Building an Effective Data Dashboard for Businesses
Step-by-step guide to building real-time dashboards for fast and accurate decisions.
Building an effective data dashboard for your business
What is a data dashboard?
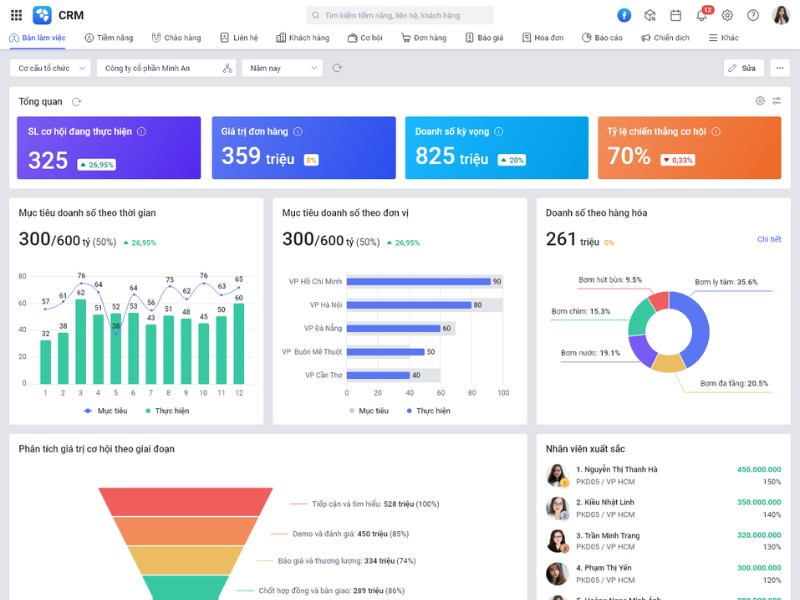
As businesses increasingly run on data, the dashboard has become an indispensable tool for managers. A data dashboard is a visual control panel that brings together key indicators (KPIs) from many sources such as the CRM, sales software, website, advertising or accounting. Everything is shown on one interface so users can easily monitor and analyze it.
Instead of spending hours compiling reports by hand in Excel, a dashboard lets a business see how operations are going in real time, spot problems quickly and make decisions based on data.
Why does a business need a data dashboard?
Many businesses now own a huge amount of data but do not use it effectively. Data sits scattered across departments, which makes compiling it slow and error-prone. This is exactly why dashboards are being adopted more and more widely.
Monitor business performance in real time
Leadership can track revenue, profit, order volume, conversion rate or sales performance whenever needed. Continuous updates let the business react quickly to market changes.
Shorten the time spent on reports
Instead of exporting data every week or month, compiling reports by hand and checking them again and again, a dashboard updates figures automatically from the related systems. As a result, staff have more time to focus on activities that create value.
Support accurate decisions
Decisions made on gut feeling often carry hidden risk. A dashboard offers a visual view that helps managers assess trends, recognize opportunities and decide based on concrete evidence.
Increase transparency between departments
When everyone uses the same single source of data, departments such as sales, marketing, customer care and finance share one view of performance. This reduces disputes over figures and improves coordination.
Common types of dashboard in a business
Depending on management goals, a business can build several different dashboards.
Executive dashboard: For leadership, with overview indicators such as revenue, profit, growth, cash flow, return on investment and operating status.
-
Sales dashboard: tracks sales by staff member, region and product; the closing rate; average order value; and sales team performance.
-
Marketing dashboard: brings together data from advertising and media channels such as Google Ads, Facebook Ads, SEO or email marketing. Commonly watched indicators include ad spend, number of leads, CPA, ROAS and conversion rate.
-
Customer care dashboard: helps a business assess service quality through response time, request resolution rate, customer satisfaction and the rate of returning customers.
A process for building an effective data dashboard
A good-looking dashboard is not necessarily a useful one. To deliver real value, a business needs to build it through a sound process.
Define the business goal
This is the most important step. The business needs to answer questions such as:
- Who is the dashboard for?
- Which indicators do users need to track?
- What is the end goal?
For example, a sales director cares about sales and conversion rate, while a marketing manager needs to follow campaign performance and the cost of generating leads.
Choose the right KPIs
Do not put too many indicators on one dashboard. It overloads users with information and makes it hard to focus on the core issues.
Prioritize KPIs that directly reflect business goals and support decision-making.
Standardize data sources
One reason dashboards are inaccurate is inconsistent input data. A business needs to check, clean and standardize its data before connecting it to the system.
Common data sources include:
- CRM
- ERP
- Website
- Google Analytics
- Advertising platforms
- Accounting software
- Sales systems
Design a clear interface
An effective dashboard should be easy to read, easy to understand and easy to act on.
A few design notes:
- Arrange information by priority.
- Use charts that fit each type of data.
- Avoid distracting colors.
- Add filters so users can look things up quickly.
Review and optimize regularly
Management needs can change at each stage of growth. So a dashboard should be reviewed regularly to update KPIs, add data sources and remove indicators that are no longer needed.
Common mistakes when building a dashboard
Many businesses invest heavily in tools yet still do not get the results they expect.
Some common mistakes include:
- Designing too many complex charts.
- Putting too many KPIs on one screen.
- Not defining the target users clearly.
- Data that updates slowly or is inaccurate.
- Having no data governance process.
- Focusing only on appearance and ignoring how well it supports decisions.
Avoiding these mistakes helps a business save on implementation cost and raise the value it gets from the dashboard.
Current trends in building data dashboards
Digital transformation is driving demand for real-time data analysis. Modern dashboards do more than display figures; they also include many smart features.
Some notable trends include:
- Automatic multi-platform data connection.
- Using artificial intelligence to forecast trends.
- Role-based access control.
- Dashboard access on mobile devices.
- Automatic alerts when an indicator crosses a threshold.
These trends help a business react faster and manage more proactively.
FAQ about building a data dashboard
How is a data dashboard different from a traditional report?
Traditional reports are usually prepared periodically, by day, week or month, and need manual compilation. A dashboard, by contrast, updates data automatically in real or near-real time, letting users monitor continuously and interact with the data directly.
Does a small business need a dashboard?
Yes. Even a small business needs a dashboard to follow revenue, cost, marketing performance and sales activity. Getting access to data early helps a business build the habit of managing by figures rather than by feeling.
Conclusion
Building an effective data dashboard is not simply about creating a visual report. It is a foundation that helps a business manage with data, track operating performance and make faster, more accurate decisions.
For a dashboard to deliver real value, a business needs to start from a clear business goal, choose the right KPIs, standardize its data and keep optimizing as real needs change. In an increasingly competitive environment, businesses that use data well will have a big advantage in sustainable growth and in sharpening their decision-making.
Need tailored advice for your business?
Click Star helps you build a solution that fits your industry and scale. We answer every question during business hours.