How important UI and UX are for technology products
How UI, UX and usability differ, the evidence on revenue impact, a practical design process and the metrics to measure experience, drawing on Nielsen Norman Group, Baymard and Google-commissioned research.
2 technology products with the same features, the same price and the same technical quality can still produce very different business results, and an important part of the difference lies in whether users manage to do what they came to do, how quickly, and how they feel while doing it.
That is the field of UI and UX. UI (user interface) is what users see and touch. UX (user experience) is much broader: it covers every aspect of a user's interaction with the product, from the moment they find it to the moment they get a result.
This article explains the difference between the two, the evidence that UI and UX affect business results, how to design and test experience in practice and the metrics to measure it with.
The figures come from Nielsen Norman Group, the Baymard Institute, a study Deloitte carried out for Google and other sources, each named in the sentence that uses it and checked as of October 20, 2026.
Key points
- UX covers every aspect of the user's interaction with a product and service, and UI is only one part of it. According to Nielsen Norman Group, a movie review site with an excellent search interface can still deliver a poor experience if the films users want are missing.
- According to the Baymard Institute, the average online cart abandonment rate is 70.22% (aggregated from 50 studies). Among the reasons given, 17% were a checkout process that was too long or complicated, 18% were being forced to create an account and 17% were a website that had errors or crashed.
- A study by Deloitte Digital for Google recorded that a 0.1-second improvement in mobile site speed went with an 8.4% rise in conversion on retail sites and 10.1% on travel sites. This is a correlation from one study, measured under specific conditions.
- Testing with about 5 users per round finds most usability problems: according to Nielsen Norman Group, 5 users find about 85% of problems under their study conditions, and several small rounds are better than one large one.
- Accessibility is part of interface quality. W3C's WCAG 2.2 is the international reference standard, with level AA commonly used as a practical target.
- Good UI and UX must be measured with metrics: task completion rate, time on task, error rate, conversion rate and satisfaction, rather than relying only on whether something feels attractive.
How UI, UX and usability differ
Nielsen Norman Group defines user experience as all aspects of the end user's interaction with the company, its services and its products. A good experience first meets customers' exact needs, and only then adds simplicity and elegance so that the product is enjoyable to own and use.
They also stress that good experience goes beyond what customers say they want or a checklist of features, and requires several disciplines working together, such as engineering, marketing, graphic design and interface design.
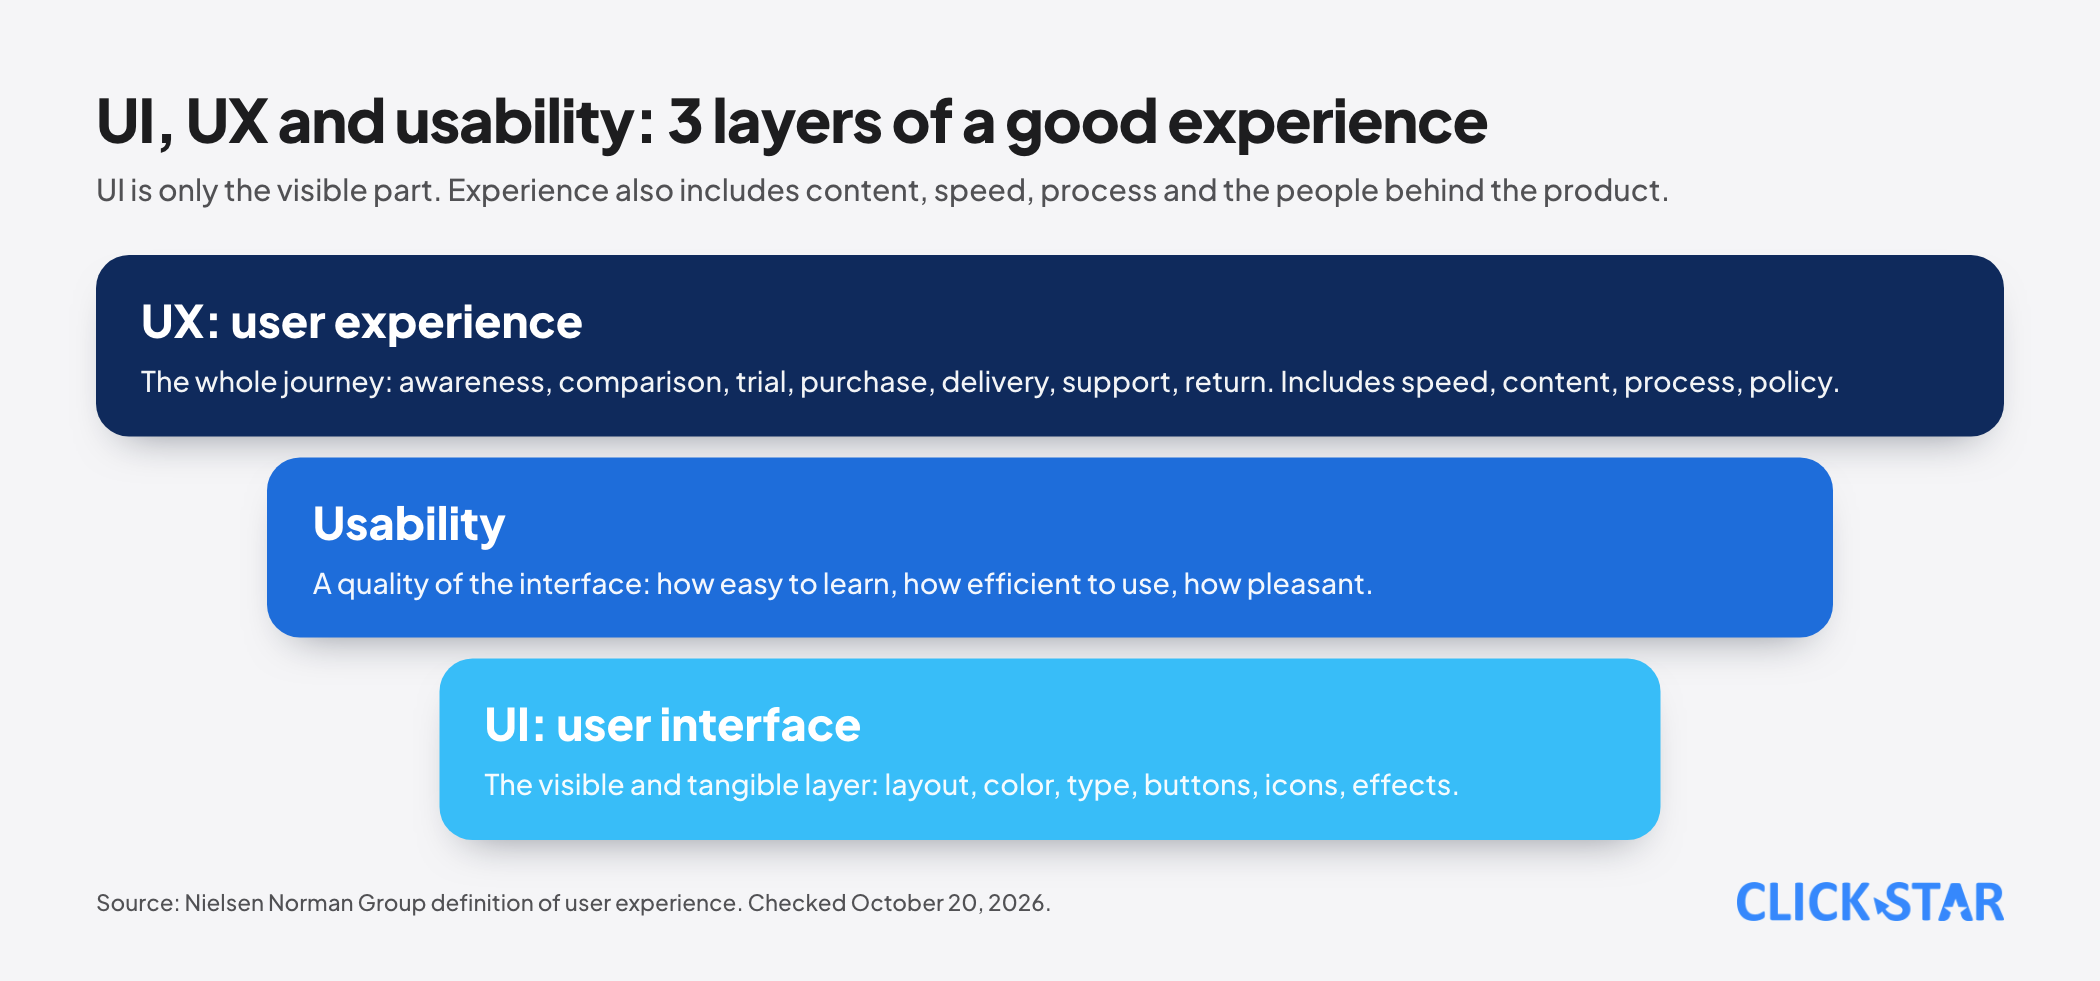
From this, 3 concepts can be told apart:
- UI is the visible and tangible layer: layout, color, type, buttons, icons and effects.
- Usability is a quality of the interface: how easy it is to learn, how efficiently it can be used and how pleasant it feels, as Nielsen Norman Group describes it. It is a narrower part of UX.
- UX is the whole journey: from awareness, comparison, trial, purchase and delivery to asking for support and coming back or leaving. It includes speed, content, process, policy and the people behind the product.
Nielsen Norman Group's example is worth remembering: a movie review site can have an excellent search interface and still give a poor experience if its database lacks the independent films a user wants to find. Put differently, beautiful design cannot make up for a product that does not solve the right problem.
Evidence of the effect on business results
Abandoned carts and checkout
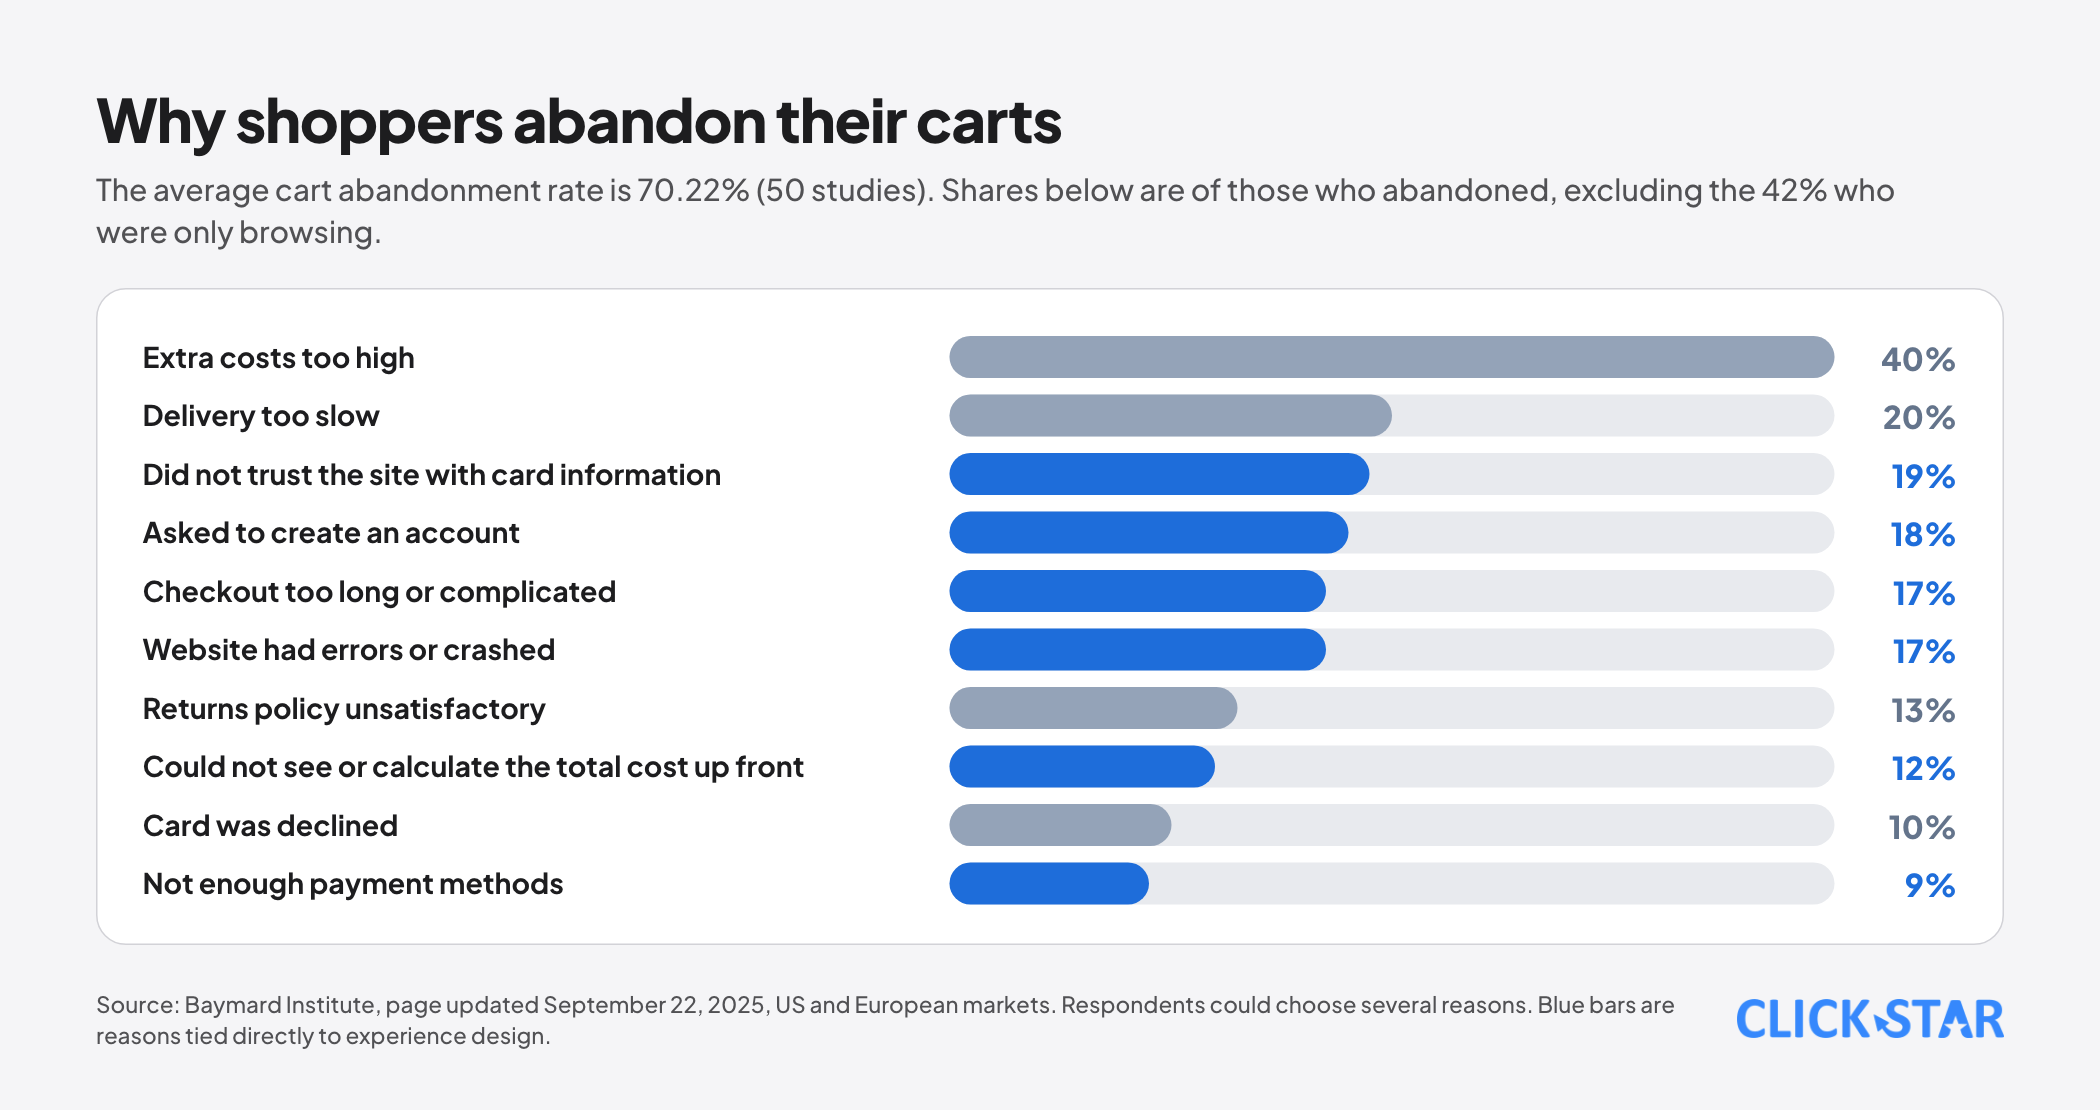
The Baymard Institute, a research body that specializes in e-commerce experience, aggregates 50 studies and reports an average cart abandonment rate of 70.22% (data page updated September 22, 2025).
When it analyzes the reasons of those who abandoned, excluding the 42% who were only browsing with no intent to buy, Baymard records: 40% because extra costs were too high, 20% because delivery was too slow, 19% because they did not trust the site with card information, 18% because they were asked to create an account, 17% because checkout was too long or complicated, 17% because the website had errors or crashed, 12% because they could not see or calculate the total cost up front and 9% because there were not enough payment methods.
Respondents could give more than one reason, so the shares do not add to 100%.
From this data, Baymard estimates that an average large e-commerce site could raise its conversion rate by 35.26% by improving checkout. That is Baymard's own estimate, based on US and European markets, so it cannot be applied directly to a specific business in Vietnam.
What to take from it is that many of the top reasons for abandonment belong to experience design: making the total cost transparent, not forcing account creation, shortening forms, making sure the site does not fail and creating a sense of trust at the payment step.
Speed is part of the experience
The study "Milliseconds Make Millions", carried out by Deloitte Digital for Google and published on web.dev, analyzed mobile data from 37 retail, travel, luxury and lead-generation brands in Europe and the US across about 30 million sessions at the end of 2019.
It found that a 0.1-second improvement in mobile site speed went with a conversion rate that was 8.4% higher in retail and 10.1% higher in travel, and retail shoppers spent 9.2% more.
A condition to note is that the 0.1-second improvement had to apply to 4 metrics at the same time across every page of the user journey, and that this is a study commissioned by Google for which no independent replication was found.
Click Star's view. This figure should not be used as a promise of revenue growth.
It should be read as showing that speed is a measurable quality of the experience, and that setting a speed target at the design stage, such as the target of a PageSpeed score of 90 or higher that Click Star's website design service page states, is better than optimizing after the build is finished.
Trust and brand perception
In Baymard's list of reasons for abandoning a cart, 19% of users did not trust the website with their card information.
In Click Star's judgment (not a measurement), the interface is among the first things users see when deciding whether to trust a website: clear text, complete contact details, understandable error messages, instant loading feedback and a sensible information hierarchy.
A cluttered interface or constant small errors is not only annoying but also makes users doubt the capability of the business behind it.
The cost of fixing experience problems early or late
Nielsen Norman Group shows that, provided users are similar to each other, 5 test users are enough to find about 85% of usability problems in one round, and it recommends 3 rounds of 5 users with redesign between rounds rather than one round of 15.
The reason is that the second round checks whether the fixes worked and finds deeper problems, while the third catches the last roughly 2% of problems. For clearly different user groups, it suggests 3 to 4 users per group.
The business argument behind this, which is Click Star's own reasoning and not a measurement, is fairly simple: an experience flaw found in a prototype costs the effort of changing a drawing, while one found after coding, launch and a large user base costs effort several times over.
UI and UX for internal tools matter too
Many businesses invest in design for the sales website but neglect the interface of internal tools such as the CRM, dashboards or management software. This is a common mistake because employees are users too, and their experience decides whether the tool is actually used.
A CRM with many mandatory fields, extra steps and hard-to-understand error messages makes staff avoid it, fill it in carelessly or go back to spreadsheets. The result is missing and wrong data, and so unreliable reports.
Click Star has a separate article on why businesses should use a database in online operations, and an easy-to-use entry interface is a condition for that database to hold clean data.
Accessibility and language
Accessibility means the product can be used by as many people as possible, including people who are blind, deaf, have limited mobility or are simply using a phone in bright sunlight.
W3C's WCAG 2.2, the international reference standard, organizes its criteria under 4 principles: content must be perceivable, operable, understandable and robust enough for a range of assistive technologies to read, with three conformance levels, A, AA and AAA. In practice many organizations set level AA as the target: sufficient contrast, keyboard operability, clear field labels and error messages that say how to fix the problem.
Language is also part of UX. Google's Gemini Southeast Asia report (published July 14, 2026) found that 89% of prompts from Vietnamese users are written in Vietnamese, the highest share in the region.
Vietnamese users expect interfaces and messages in natural Vietnamese: clear button labels, error messages in everyday language, the right industry terminology and no stiff machine translation.
A practical UI/UX design process
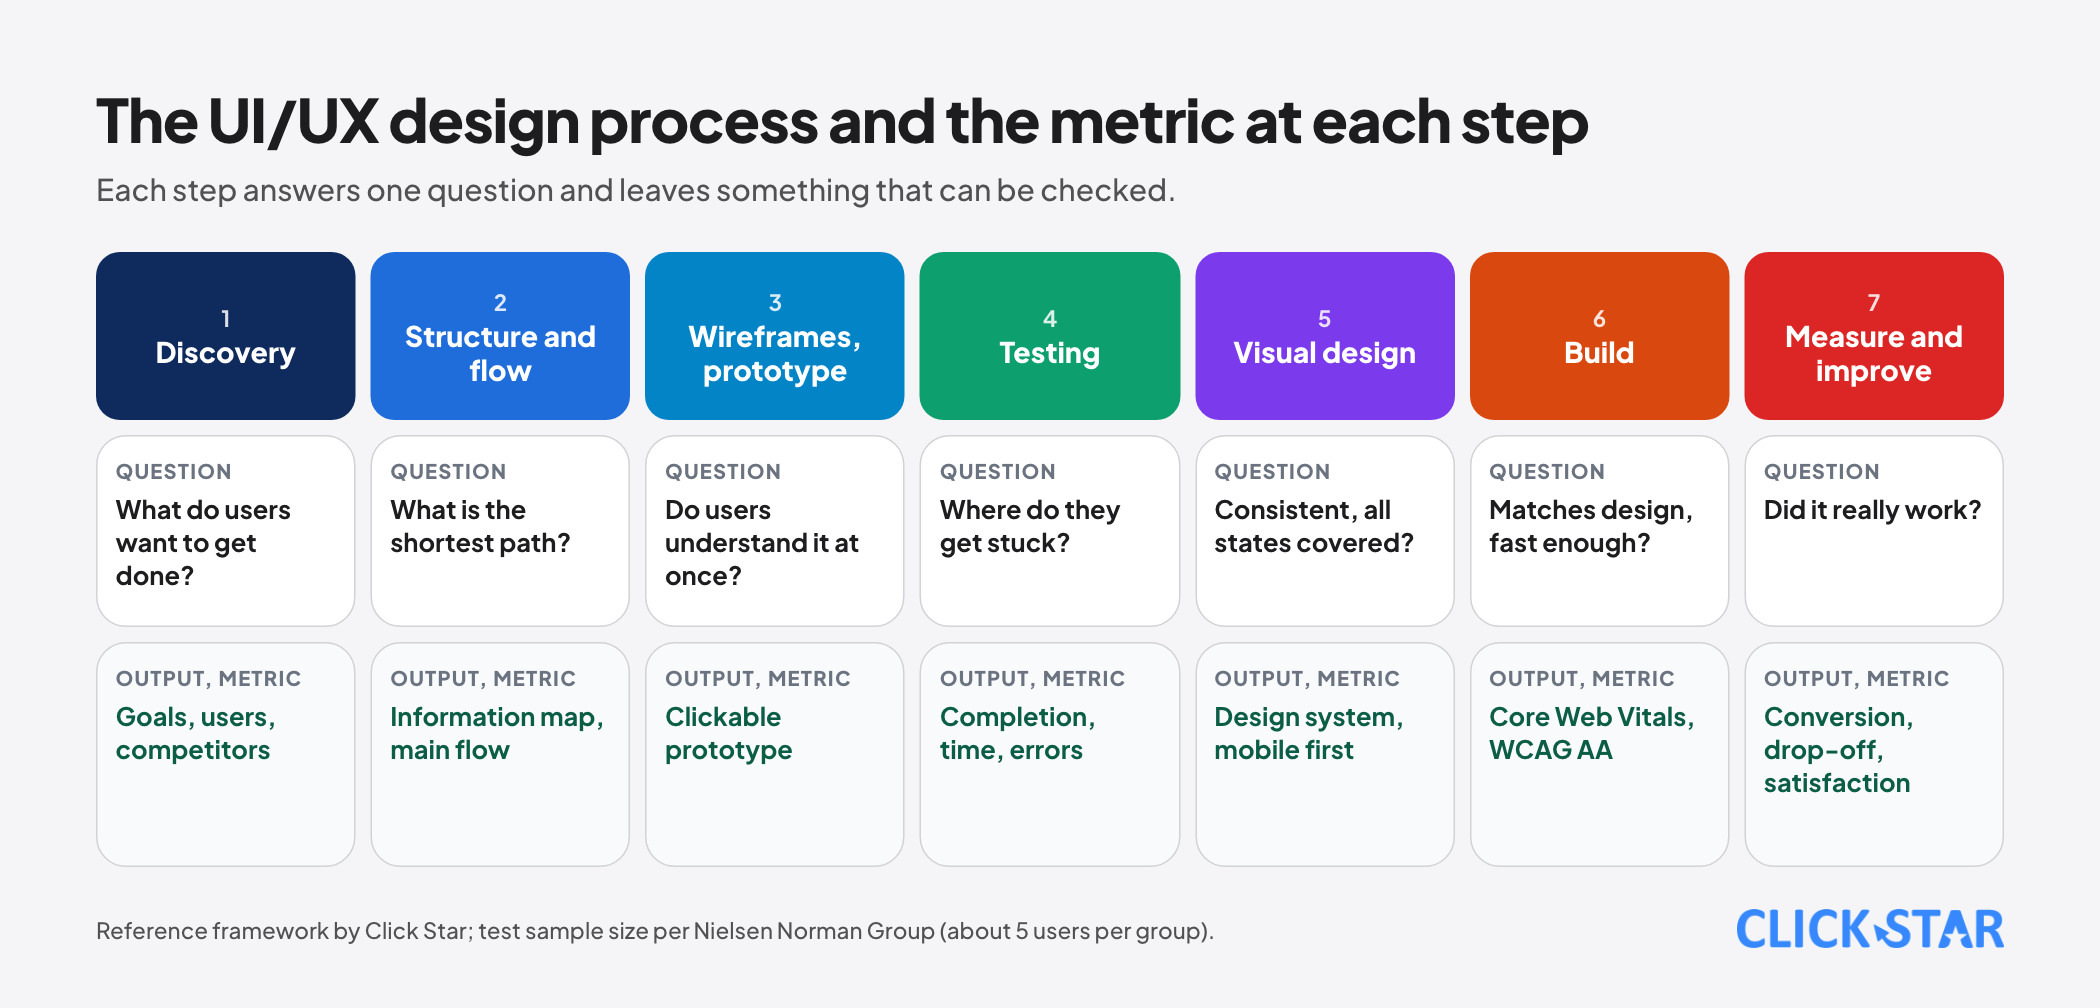
Click Star's view. The process below summarizes how a project is usually organized, and each step should be tied to a question to answer:
- Discovery: business goals, who the users are, how they do this task today and how competitors do it. Question: what do users want to get done?
- Structure and flow: information architecture, main flows (sign-up, purchase, booking, data entry) and secondary flows when there is an error or missing data. Question: what is the shortest path?
- Wireframes and prototype: sketch the layout on paper or in a tool such as Figma and build a clickable prototype. Question: do users understand it immediately?
- Testing with real users: about 5 per group, give them tasks and watch them work without guiding them. Question: where do they get stuck?
- Visual design: color system, type, components and states (loading, empty, error, success), designed for phones first.
- Build and check: match the design, measure speed, check accessibility and test on multiple devices.
- Measure and improve: track the metrics after launch and fix based on real data.
Which metrics measure UX
- Task completion rate: what percentage of users finish the assigned task in a test.
- Time on task: the shorter the better, compared with the previous version.
- Error rate: how many times users enter something wrong, tap the wrong thing or have to go back.
- Conversion rate and drop-off at each step of the main flow, like the cart abandonment figures Baymard tracks.
- Speed and stability metrics such as Google's Core Web Vitals.
- Satisfaction, for example the SUS scale, a standardized 10-question usability questionnaire, or a rating question after an action.
- For internal tools: the share of staff who use it regularly, the share of data fields filled in completely and the number of support requests about how to use it.
Common mistakes
- Treating UI as UX and assuming an attractive interface is enough, when the real problem lies in the flow, the content or the features.
- Designing to the taste of people inside the company instead of observing real users.
- Testing only once at the end of the project, when fixes are already expensive.
- Designing and testing only on a computer and leaving the phone experience as work for later.
- Ignoring speed, error messages, empty states and the less attractive states that users meet often.
- Ignoring accessibility until someone complains.
- Not measuring after launch, so not knowing which change worked.
- Trusting a single figure. The studies above measured users in other markets under their own conditions, so verify with the data of your own product.
Related posts
Need tailored advice for your business?
Click Star helps you build a solution that fits your industry and scale. We answer every question during business hours.