What a converting website looks like: 7 components and how to measure
7 components of a converting website, each backed by evidence from Unbounce, Nielsen Norman Group, Baymard and Google, plus an improvement process, a 30-day plan and the metrics to track.
A beautiful website is not necessarily a website that converts. A conversion is the visitor doing what the business wants: placing an order, sending a form, making a call, messaging on Zalo, signing up for a trial. A website that converts well makes those things easy to happen and measures how often they do.
This article answers the question "what does a converting website look like" with 7 concrete components, each backed by published research or official documentation, plus how to measure and a process of continuous improvement.
The figures come from Unbounce, Nielsen Norman Group, the Baymard Institute, Google's Core Web Vitals documentation on web.dev and a study Deloitte carried out for Google, each named in the sentence that uses it and checked as of October 20, 2026.
These studies mostly measure other markets, so use them as hypotheses to test on your own website, not as targets you are sure to reach.
Key points
- Conversion should be defined for each specific business goal and measured from the start: page views are only an intermediate result.
- According to Unbounce's benchmark report, based on more than 464 million visitors and about 41,000 landing pages (Q4 2024 data), the median conversion rate (the middle value across all landing pages) of all industries is 6.6%, and it ranges from about 3.8% to 12.3% between industries. Your rate depends on industry, traffic source and offer, so set your own baseline before comparing with any figure.
- According to Nielsen Norman Group's 2018 eye-tracking study, users spend about 57% of page-viewing time in the part above the first screen's fold and 74% in the first 2 screens. The promise, the main proof and the first call to action must sit there.
- Shorter forms help: the Baymard Institute recorded that the average checkout has 11.3 form fields in 2024 and holds that most sites need only 8.
- Speed and stability are part of conversion. Google sets good thresholds for Core Web Vitals: LCP within 2.5 seconds, INP of 200 milliseconds or less, CLS of 0.1 or less, measured at the 75th percentile of page loads (that is, three of every 4 loads must meet the threshold), mobile and desktop separately.
- Improve in cycles: state a hypothesis, change one thing, measure long enough, keep or drop. Changing many things at once means not knowing which one worked.
What conversion is and which figure to compare against
Each business has one or several main conversions. For a store it is an order. For a service website it is a consultation request, a call, a Zalo message or a quote form. For content it is a newsletter sign-up or a document download.
Beyond the main conversion there are small ones, such as viewing the pricing page or opening the chat window, which help show how far visitors get before stopping.
As for a comparison level, Unbounce's report, based on more than 464 million unique visitors, 57 million conversions and about 41,000 landing pages, with Q4 2024 data, gives a median conversion rate of 6.6% across all industries.
A secondary summary lists financial services at 8.4% and software as a service (SaaS) at 3.8%, and Unbounce cites 9 industries ranging from 3.8% to 12.3%. 3 cautions. First, this is a median, not an average, and some summary pages mislabel it. Second, the data comes mainly from advertising landing pages in English-speaking markets.
Third, the rate depends heavily on the type of conversion (a document download is easier than an order). So the most trustworthy comparison level is your own website's rate last month.
7 components of a converting website
1. A clear promise in the first 5 seconds
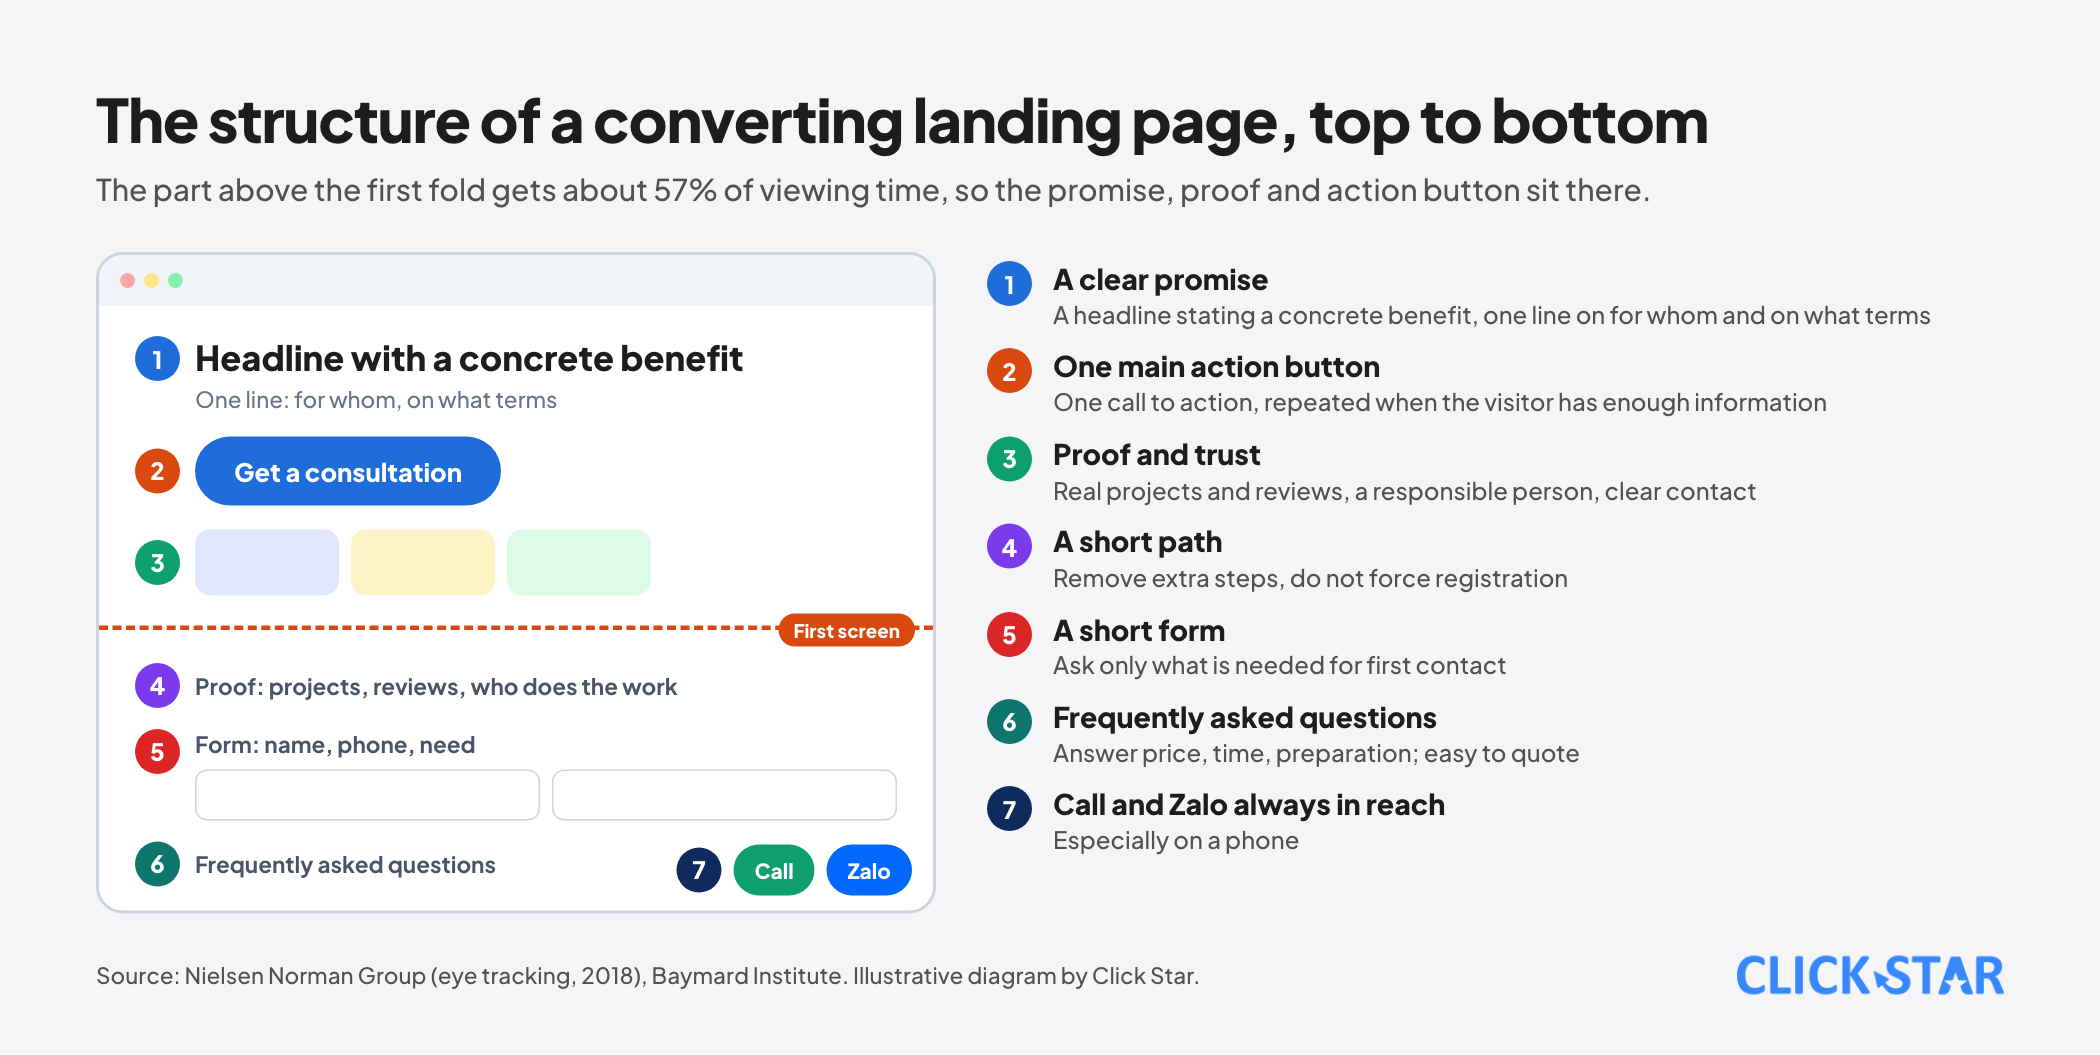
Visitors need to understand at once what you do, for whom and why they should choose you. Nielsen Norman Group, in its 2018 eye-tracking study, recorded that users spent about 57% of viewing time above the fold of the first screen and 74% in the first 2 screens, against 80% in the top part in its 2010 study.
It advises reserving the top of the page for high-priority content and placing the main call to action there. In practice: one headline stating a concrete benefit, one supporting line stating for whom and on what terms, and one action button, not five.
2. Proof and trust signals
In the Baymard Institute's list of reasons for abandoning a cart (aggregating 50 studies, with an average abandonment rate of 70.22%), 19% of shoppers did not trust the website with their card information.
For a service website, trust signals are real contact details and address, the names and roles of the people who deliver, projects or clients that have given permission to be named, verified reviews, clear policies and security shown in the right places. Use only proof that is real; no invented figures or disguised sample photos.
3. A short path to action
Each page should have one main goal and one clear path. Baymard recorded that 18% of abandoners left because they were asked to create an account and 17% because checkout was too long or complicated.
The lesson applies more widely than e-commerce: remove unnecessary steps, allow completion without registering and repeat the call to action at points where the visitor already has enough information to decide.
4. Short, easy-to-fill forms
Baymard recorded that the average checkout has 11.3 form fields (in 2024) and judged that most sites need only 8. For a lead form the principle is similar: ask only what is needed for the first contact (name, phone or email, need) and leave detailed questions for the next conversation. Each added field is another reason to give up.
Clear labels, error messages that say how to fix the problem, and a submit button that says what happens next (for example "Get a consultation during business hours").
5. Speed and stability
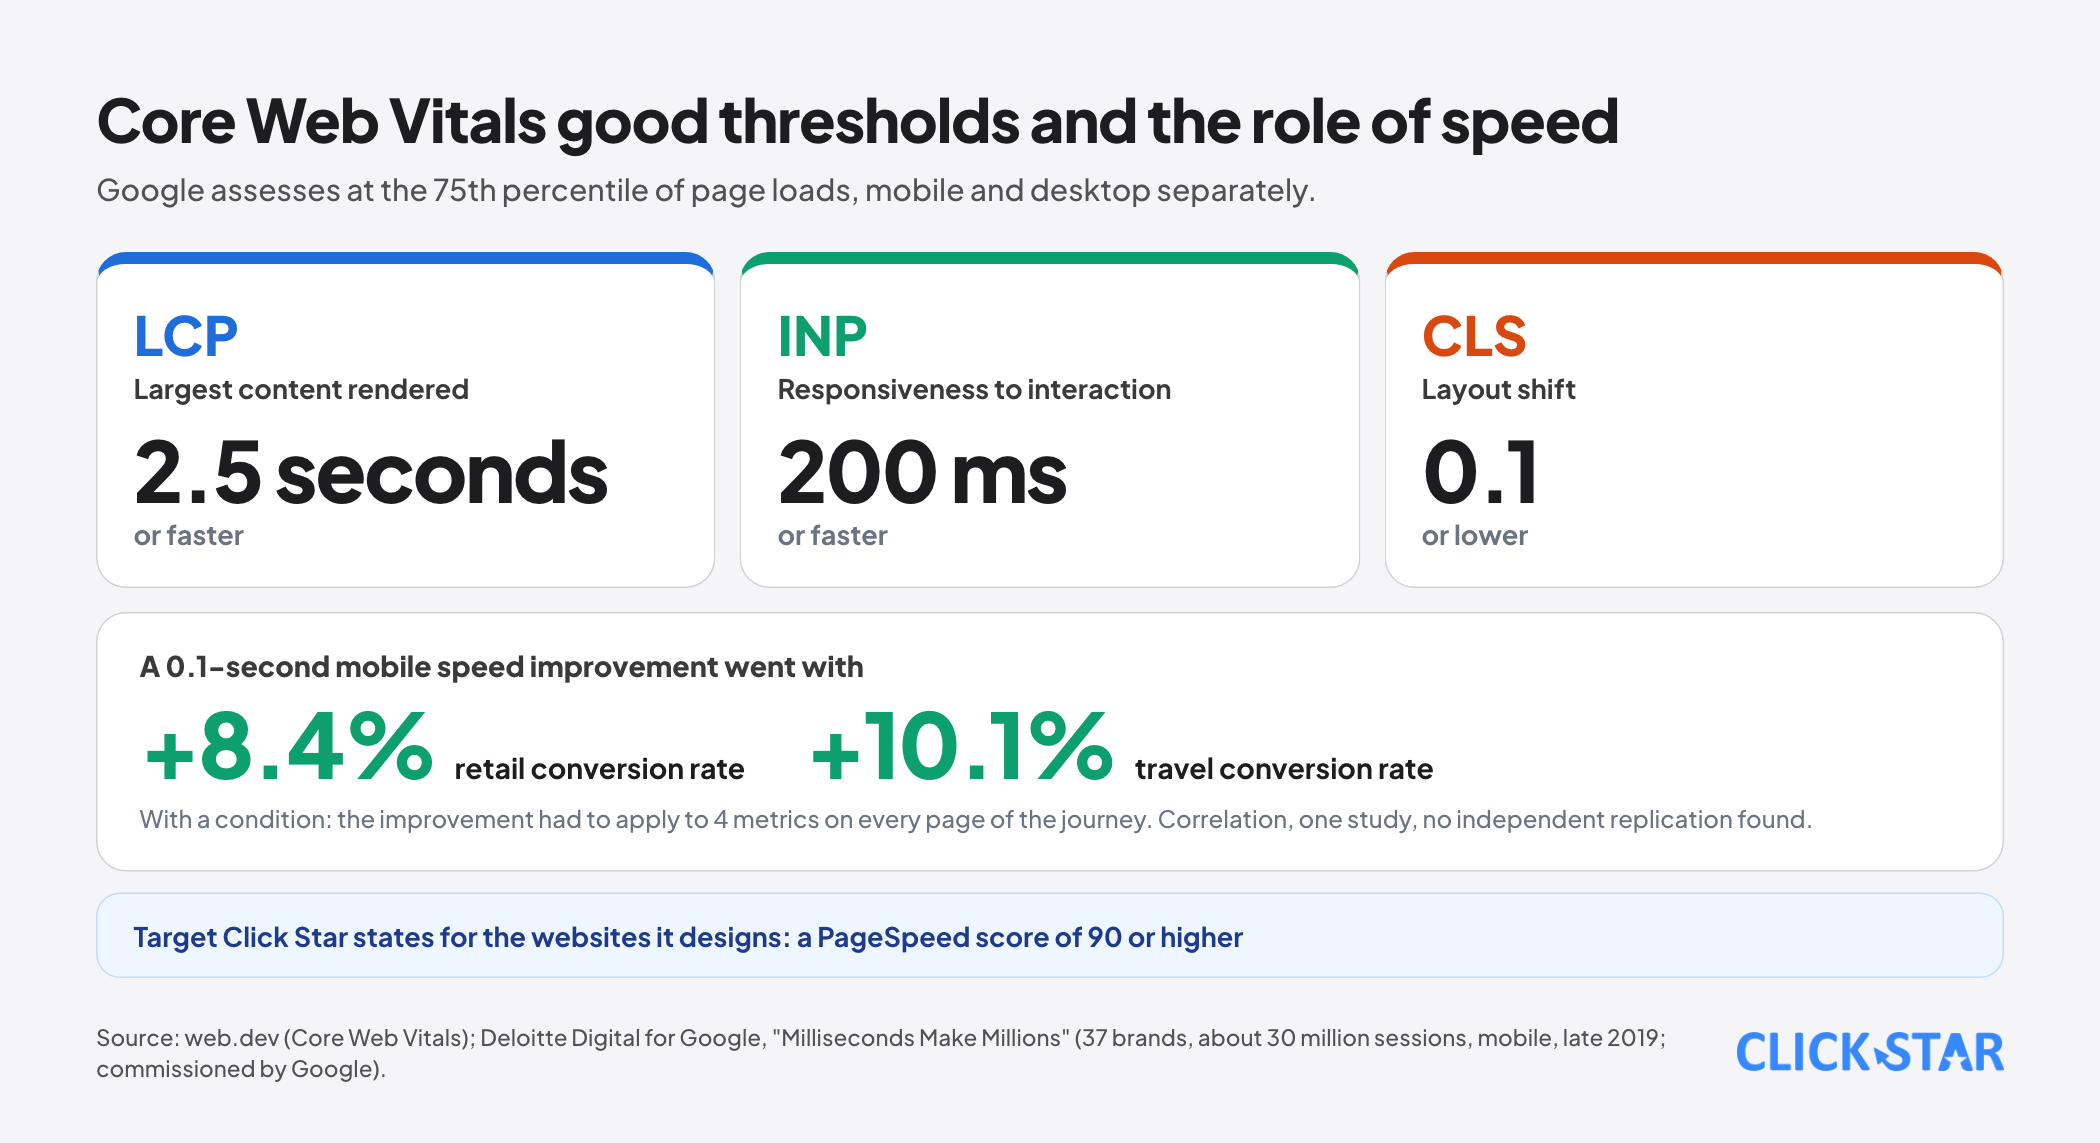
Google, in its Core Web Vitals documentation on web.dev, names 3 metrics and good thresholds: LCP, the time to render the largest content element, within 2.5 seconds; INP, interaction responsiveness, of 200 milliseconds or less; CLS, layout shift, of 0.1 or less, all measured at the 75th percentile of page loads and split between mobile and desktop.
The study "Milliseconds Make Millions", carried out by Deloitte for Google, recorded that a 0.1-second improvement in mobile speed went with an 8.4% rise in conversion in retail and 10.1% in travel, provided the improvement applied to 4 metrics on every page.
It was a study commissioned by Google, so treat speed as a prerequisite of the experience, not as a promise of higher revenue. Click Star states a target of a PageSpeed score of 90 or higher for the websites it designs.
6. Works well on a phone
Core Web Vitals are assessed separately for mobile and desktop, and the Deloitte study measured mobile. Design for the phone first: buttons large enough to tap, text readable without zooming, forms that bring up the right keyboard (numeric for phone numbers) and a call button and a Zalo message button always within reach of the thumb.
7. Measurement from day one
Without measurement there is no improvement. You need: clear definitions of main and secondary conversions, tracking of traffic sources (ads, search, social, referral, direct), the chain of steps from landing to conversion to see where visitors drop and a connection to the CRM to learn which leads actually close.
Click Star's service page describes preparing conversion tracking for Google Ads and Meta Ads, including pixels, remarketing and A/B testing, and integrating a CRM with commerce websites. On personal data, notices, cookie consent and recording of consent are needed as the rules require.
Content for readers and for AI tools
A converting website does not serve only people who already know you. As customers increasingly read a synthesized answer before deciding, content should answer the questions customers often ask directly at the top of each section: roughly what it costs, how long it takes, what to prepare.
Click Star has separate articles on the shift in SEO in the AI era and on user search trends, and on UI and UX. A frequently-asked-questions block at the bottom of a service page both helps customers decide faster and is a passage that is easy to quote.
A process for improving conversion
- Observe: read the numbers to see which step visitors drop at, watch behavior recordings and listen to the questions customers often ask.
- State a hypothesis: "If we cut the form from 8 fields to 4, the submission rate will rise because there are fewer barriers."
- Test one change: split visitors evenly between the old and new versions, holding everything else equal.
- Measure long enough: enough visits and enough weekly cycles, avoiding early conclusions from a few days or a few dozen visits.
- Decide and record: keep, drop or test further, and save the result so old tests are not repeated.
A note for low-traffic websites: with low traffic, an A/B test takes many weeks to gather enough data. In that case, prioritize fixing obvious problems (speed, a broken form, a button that cannot be tapped on a phone) and learn directly from a few calls or from watching real users, in the way Nielsen Norman Group recommends for small, repeated rounds of testing.
A 30-day plan
- Week 1: define main and secondary conversions, set a baseline (visits, conversions, sources) for the last 30 days and check Core Web Vitals on mobile.
- Week 2: rewrite the top of the main pages using the promise, proof, action formula; shorten forms; test the call and Zalo buttons on a real phone.
- Week 3: fix the biggest speed problems (heavy images, render-blocking code), add real proof and a frequently-asked-questions block.
- Week 4: turn on step and source tracking, connect forms to the CRM, choose a first test and state its hypothesis.
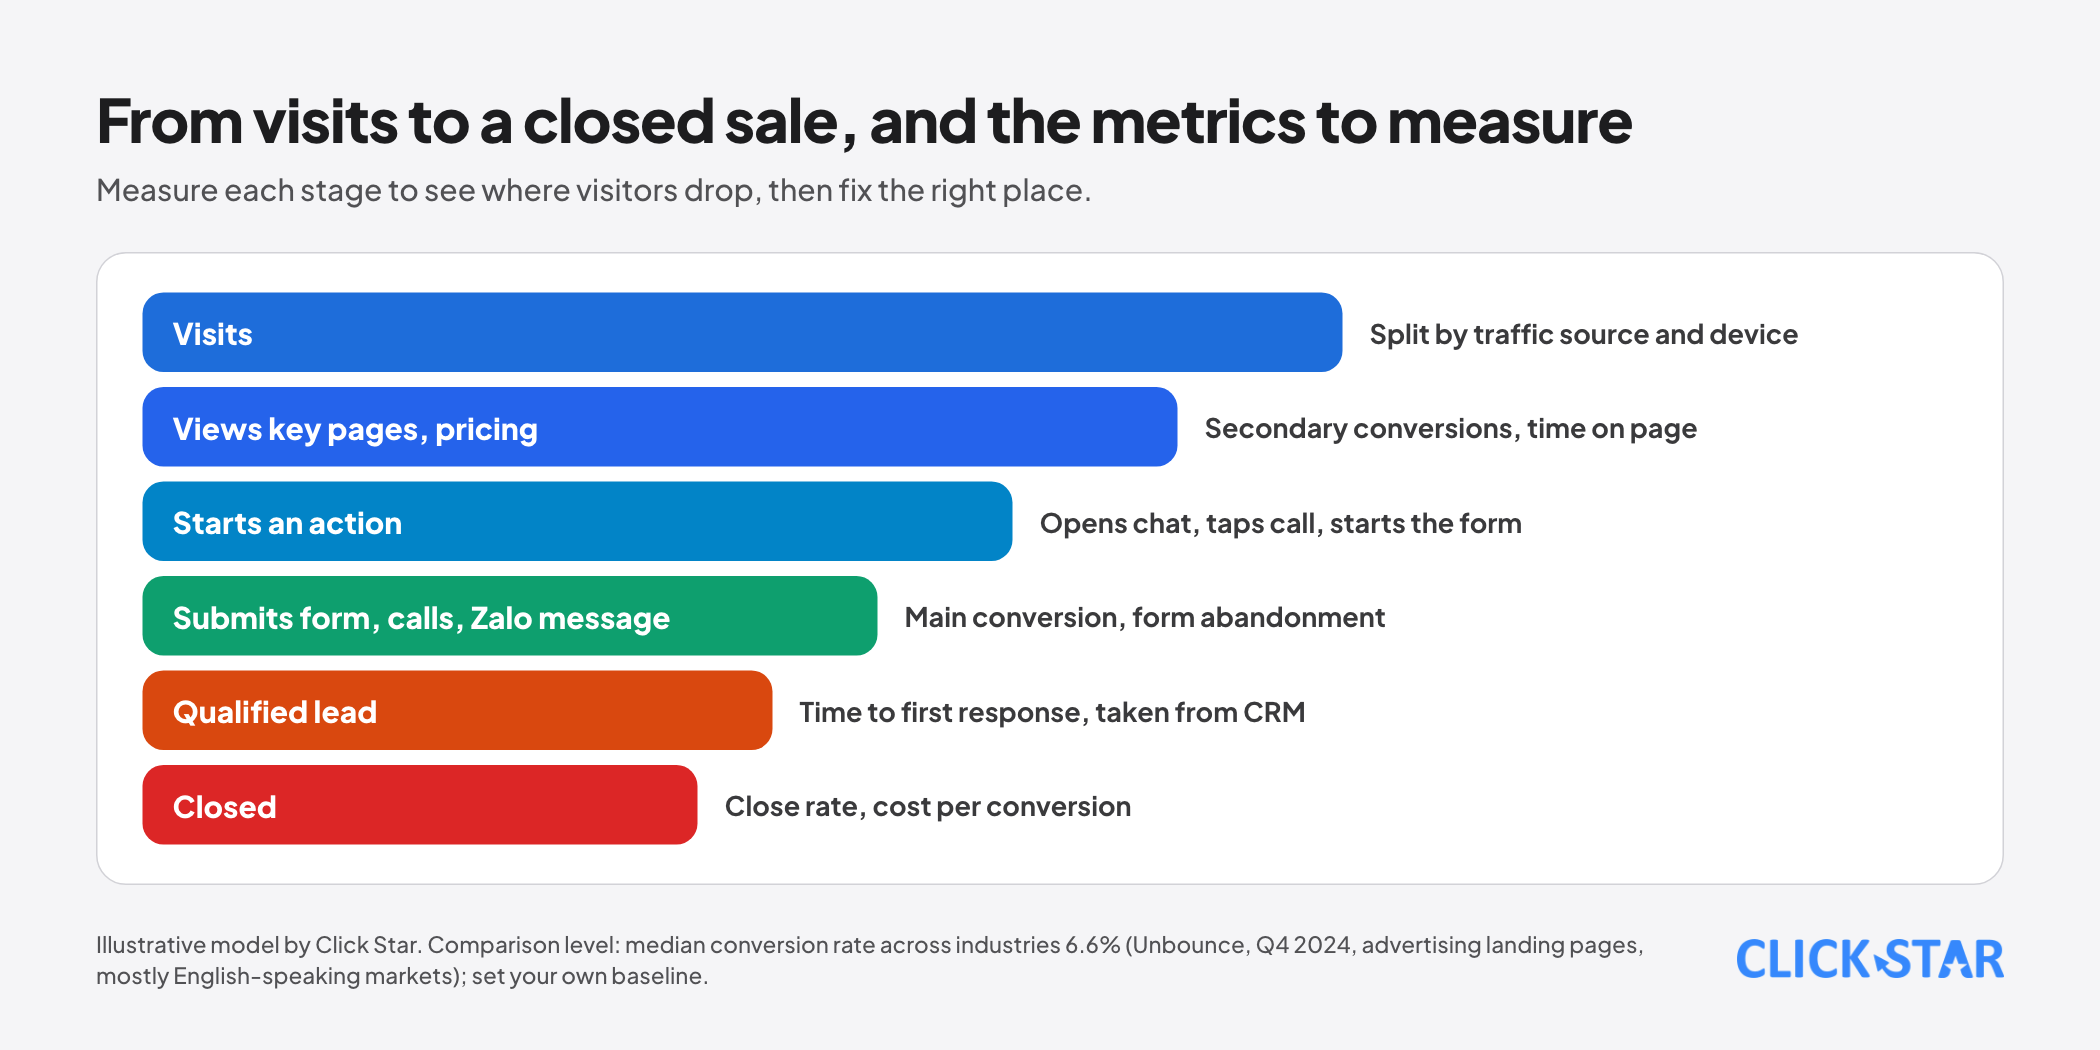
Metrics to track
- The main conversion rate, split by traffic source and by device.
- Secondary conversion rates (viewing pricing, opening chat, tapping call).
- The form submission rate and the form abandonment rate.
- Core Web Vitals on mobile and desktop.
- Time to first response for leads and the share of leads that close, taken from the CRM.
- Cost per conversion if ads are running.
Common mistakes
- Measuring page views without defining conversions.
- Crowding in many messages and many action buttons, so visitors do not know what to do first.
- Long forms that ask everything at the first contact.
- Ignoring speed, especially on mobile, because pages load fast on a computer.
- Using proof that is not real or figures that cannot be verified.
- Changing many things at once and not knowing which one worked.
- Concluding from a few days of data or a very small number of visitors.
- Not connecting the website to the CRM, so not knowing which leads actually close.
Related posts

Need tailored advice for your business?
Click Star helps you build a solution that fits your industry and scale. We answer every question during business hours.