Weekly marketing report for leadership: a 1-page dashboard template and how to present it
The article sets out a 1-page, 6-block report frame, how to lock numbers around data delay, and how to choose a source when GA4, ad platforms and the CRM disagree, based on Google, Microsoft, Tableau and Nielsen Norman Group documentation.
A weekly marketing report for leadership tends to fail in 2 ways: it is so long that nobody finishes it, or it is short but each person brings a different number from GA4, the ad platform and the CRM, and the meeting becomes an argument.
This article covers the rhythm and structure of the report, not which metrics to choose. Click Star already has articles on executive dashboard metrics, building dashboards and unifying customer data.
The main sources are Google Analytics, Google Ads, Looker Studio, Power BI, Tableau and Nielsen Norman Group documentation, read on October 21, 2026. The article answers what a 1-page report contains, when to lock numbers and which source to pick when they disagree. The templates are Click Star reference frameworks, not measurements.
Key points
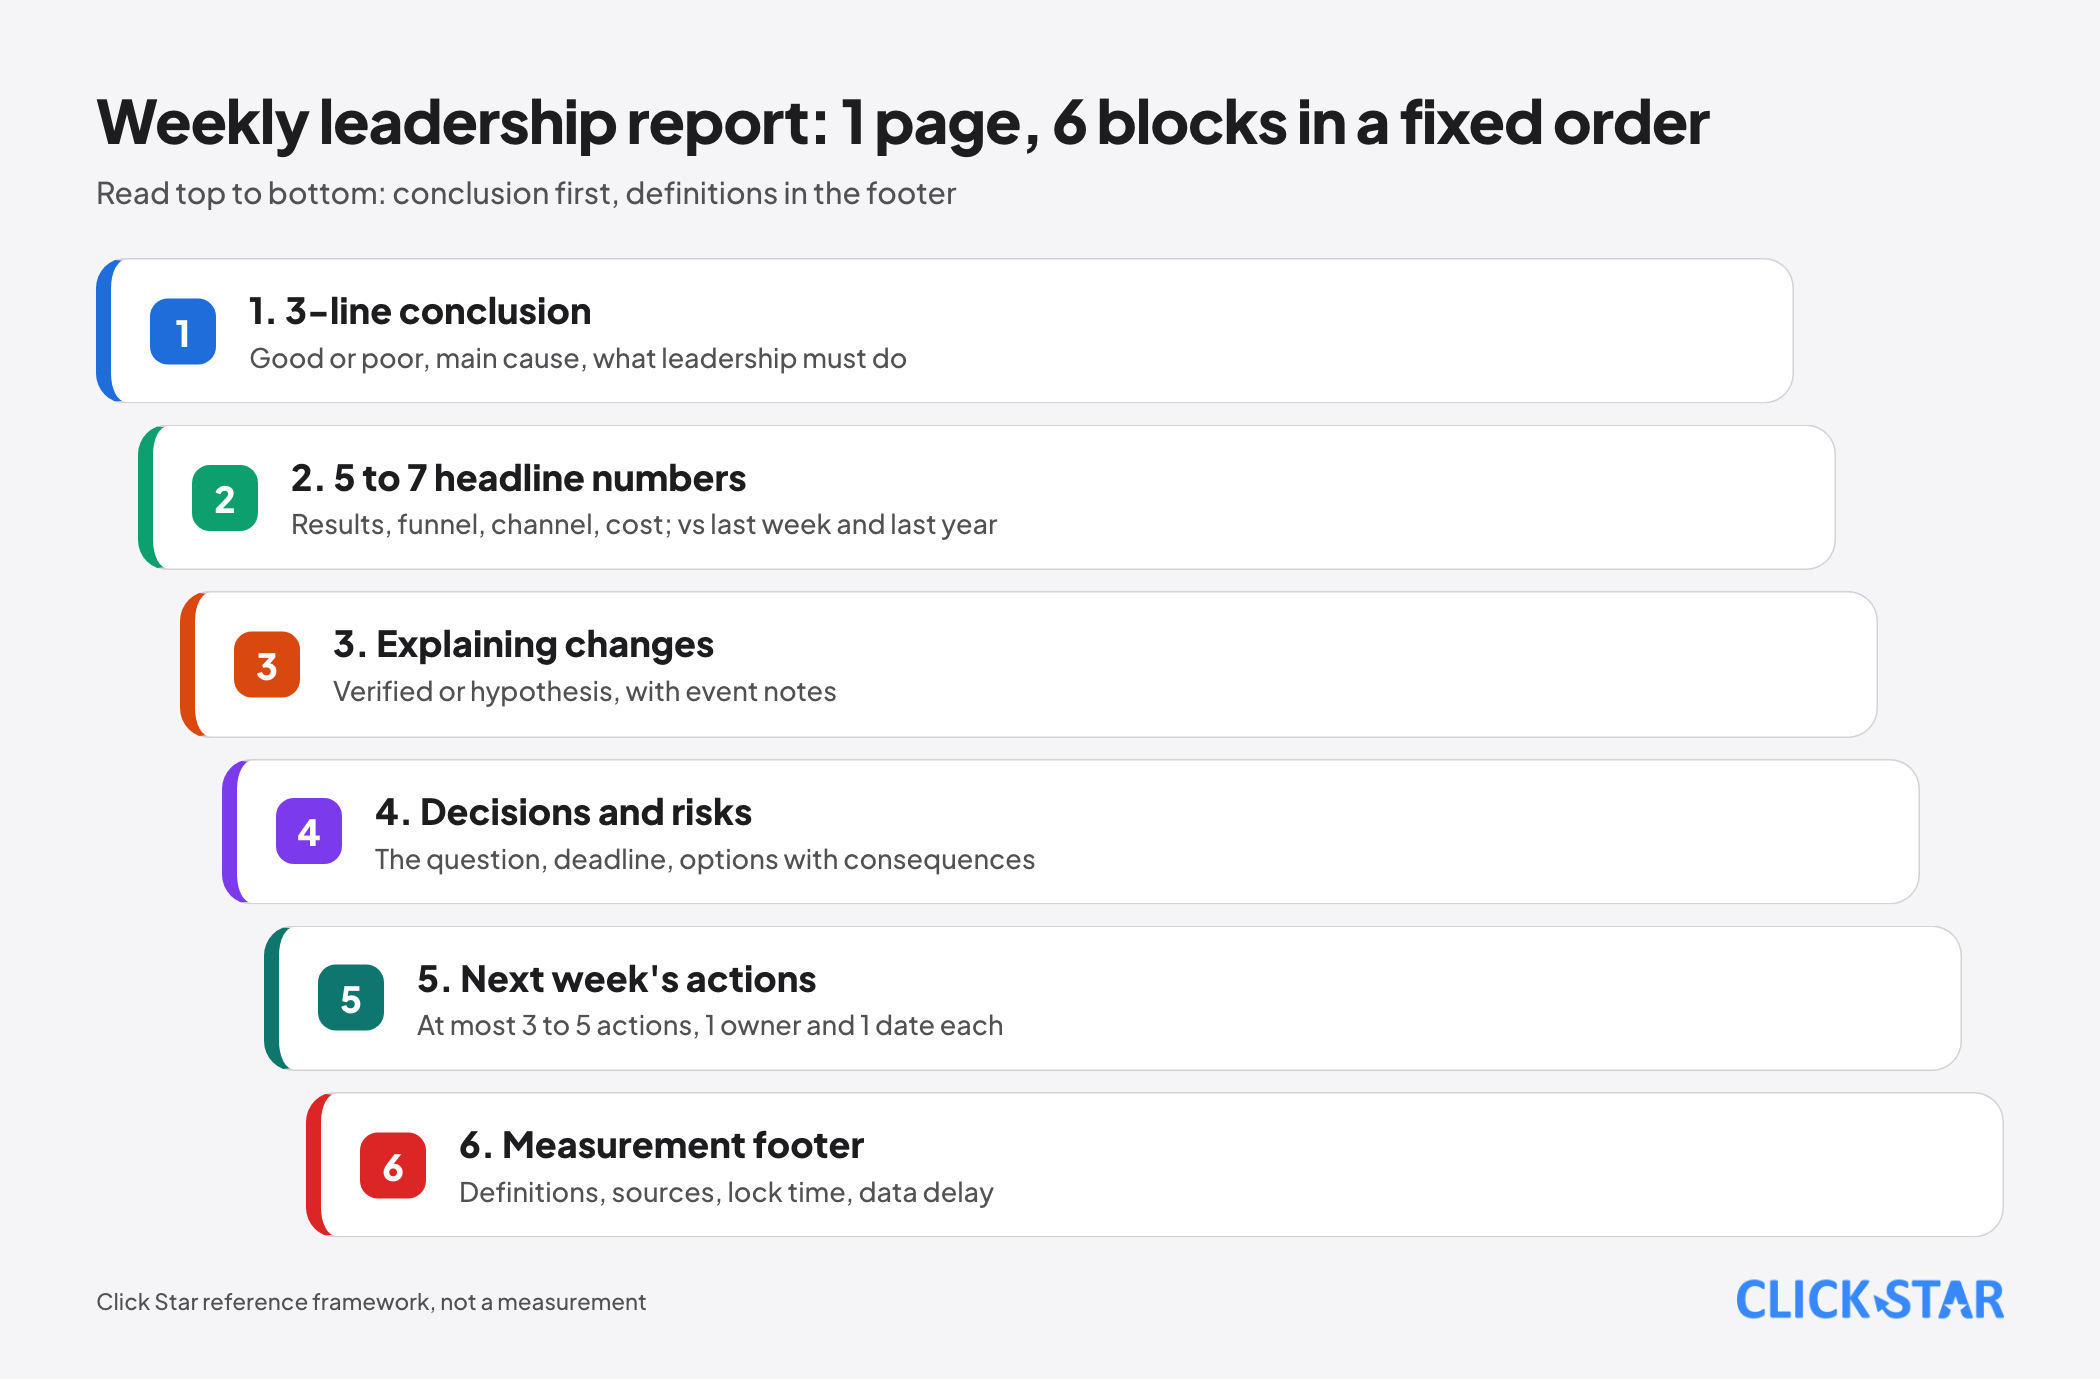
- A weekly leadership report should be 1 page in a fixed order of 6 blocks: a 3-line conclusion, 5 to 7 headline numbers, an explanation of changes, decisions and risks, next week's actions, and a measurement footer.
- Nielsen Norman Group advises putting the conclusion first. Power BI and Tableau advise placing the most important information at the top left.
- Numbers need time to settle. According to Google, GA4 processing can take 24 to 48 hours, late data can arrive within 7 days, and key event attribution can change for up to 12 days.
- GA4, Google Ads and the CRM disagree because of assignment date, attribution model, counting unit and time zone. Google puts the typical gap between Google Ads and GA4 at up to 20%.
- Each metric should have 1 source of truth, printed on the report with its definition and lock time. An event log and a 15-minute meeting turn the report into decisions.
How a weekly report differs from a dashboard
A dashboard is a screen you can open at any time; a weekly report is the closed record of 1 week, with an owner and decisions attached (Click Star's distinction).
According to Nielsen Norman Group (Page Laubheimer, June 18, 2017), a dashboard is a 1-page view for grasping key information and acting fast. The weekly report is closer to the analytical dashboard in that article: it points out trends that need a deeper look.
Nielsen Norman Group (Amy Schade, February 11, 2018) advises putting the conclusion first so readers get the main point wherever they stop.
The 1-page frame in 6 blocks
This is a Click Star reference framework, not a measurement. Each block answers 1 leadership question, read top to bottom.
Block 1, the 3-line conclusion. Line 1: whether the week was good, ordinary or poor against target and last week. Line 2: the main cause. Line 3: what leadership must do, or "no decision needed".
Block 2, 5 to 7 headline numbers. Each tile has the value, the change from last week and from the same period last year, and status against target.
Block 3, explaining changes. Explain only large movements, separate "verified" from "hypothesis", and attach event notes.
Block 4, decisions and risks. Each decision has the question, a deadline, options with consequences and a recommendation. Risks split into business and measurement, with impact in words, not invented probabilities.
Block 5, next week's actions. At most 3 to 5 actions, each with 1 owner and 1 due date.
Block 6, measurement footer. Metric definitions, sources, lock time and data delay. Small type, but it decides whether the report is trusted.
On form, Tableau advises 2 to 3 views, the most important in the upper left. Power BI advises keeping every tile on 1 screen, not mixing time frames, showing no more than 3 to 4 numerals ("3.4 million" rather than "3,400,000") and using bars and lines instead of 3D charts or round gauges (Power BI, Nielsen Norman Group).
Choosing 5 to 7 numbers and ordering them
Use 4 groups: results, funnel, channel, cost. A Click Star framework with empty labels and no measured values.
- Results (1 to 2 tiles): revenue, or orders and contracts recorded in the week.
- Funnel (2 tiles): number of leads and the qualified-lead rate, or new opportunities.
- Channel (1 tile): the channel contributing most and the channel dropping most.
- Cost (1 to 2 tiles): cost per qualified lead or per new customer.
The count of 5 to 7 is Click Star's choice to fit 1 screen; no study read here gives an optimal number. Specific metrics are covered in the article on executive dashboard metrics.
Comparing with last week, last year and target
Each number needs at least 2 reference points: last week shows momentum, the same period last year shows seasonality, and target shows the gap.
According to GA4 documentation (read October 21, 2026), the date picker offers previous period, previous period matching day of week, and previous year. The "previous year matching day of week" option was removed; the page advises "last calendar year".
Looker Studio also compares previous period, previous year or a fixed range. Its rolling week starts on Sunday by default, and "include today" counts incomplete data.
Click Star suggests a fixed Monday to Sunday week, excluding today, with holiday or promotion weeks noted. According to GA4, changing the attribution model applies to past data too, while changing the lookback window applies only going forward; log both.
When to lock the numbers and how late data arrives
Do not lock on Monday morning. According to the GA4 "Data freshness" page (read October 21, 2026), processing can take 24 to 48 hours; daily data for a standard property arrives after about 12 hours, intraday data after 2 to 6.
Late events can arrive up to 7 days later, and key event attribution can change for up to 12 days. Google Ads reports delays of 24 to 48 hours.
Looker Studio adds a cache: the Google Analytics connector refreshes every 1, 4 or 12 hours (default 12), while Google Ads is fixed at 12 hours.
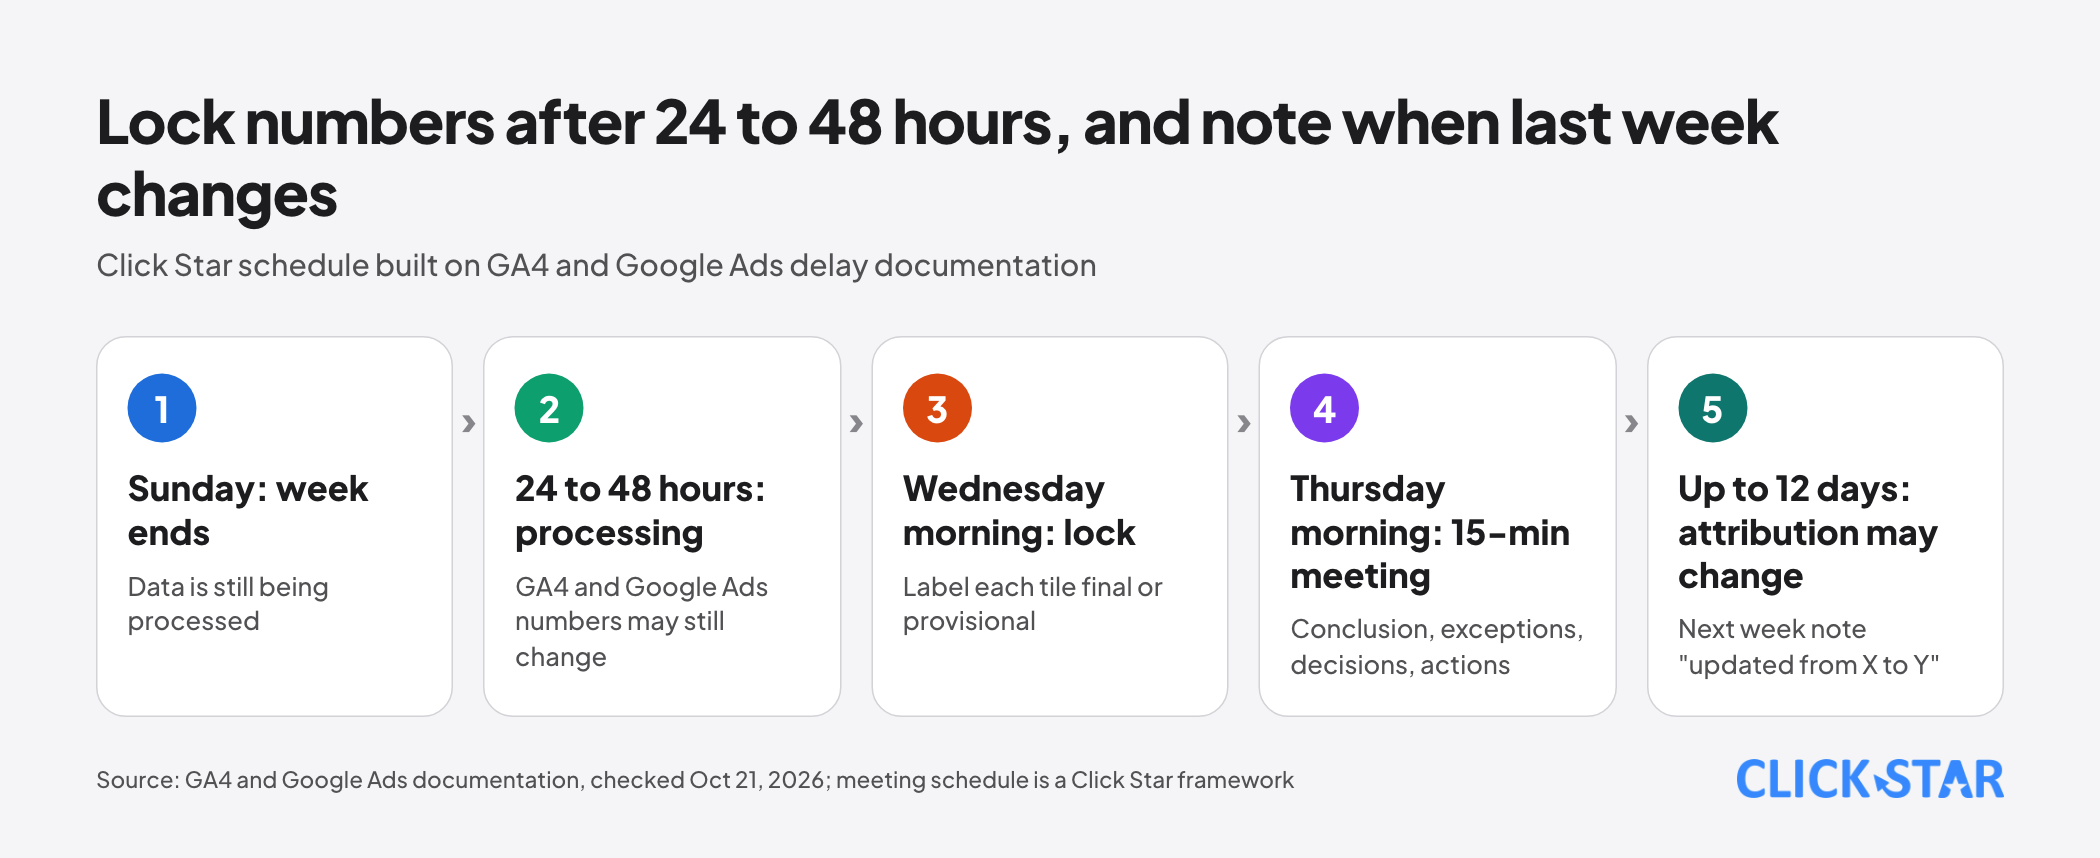
Click Star's framework: the week ends Sunday, numbers lock Wednesday morning and the meeting is Thursday morning, leaving over 48 hours. Label each tile "final" or "provisional". If last week's number changed, add 1 line "updated from X to Y" rather than silently replacing it.
Why GA4, the ad platform and the CRM disagree
Each system counts by its own rules, so gaps are normal. These causes come from Google's documentation; for Meta see What is not known.
- Assignment date: the standard Google Ads conversion columns follow the click date. Google Ads also has columns by conversion time, which Google suggests when comparing with other tools.
- Model: GA4 defaults to data-driven attribution, Google Ads uses ad-centric models. Google puts the typical gap at up to 20%.
- Counting unit: Google Ads counts clicks and removes invalid clicks, GA4 counts sessions.
- Lookback: GA4 defaults to 90 days for ordinary key events (changeable to 30 or 60) and 30 days for first-touch acquisition events.
- Time zone: GA4 uses the property time zone, Google Ads the account time zone, and standard accounts no longer support changing it.
The CRM adds a group that is Click Star's inference: it records people and opportunities, not sessions; lead creation date differs from click date; qualified status is entered by people.
Choosing 1 source of truth per metric
Each metric has 1 primary source, printed on the report; other sources serve only for reconciliation. Power BI has a similar idea: "certified" content meets organizational quality standards, set by authorized reviewers. Name who decides which source is trusted.
The table is a Click Star framework, not a measurement: put the source where the real event happens. Money is charged on the platform, customers live in the CRM, website behavior in GA4.
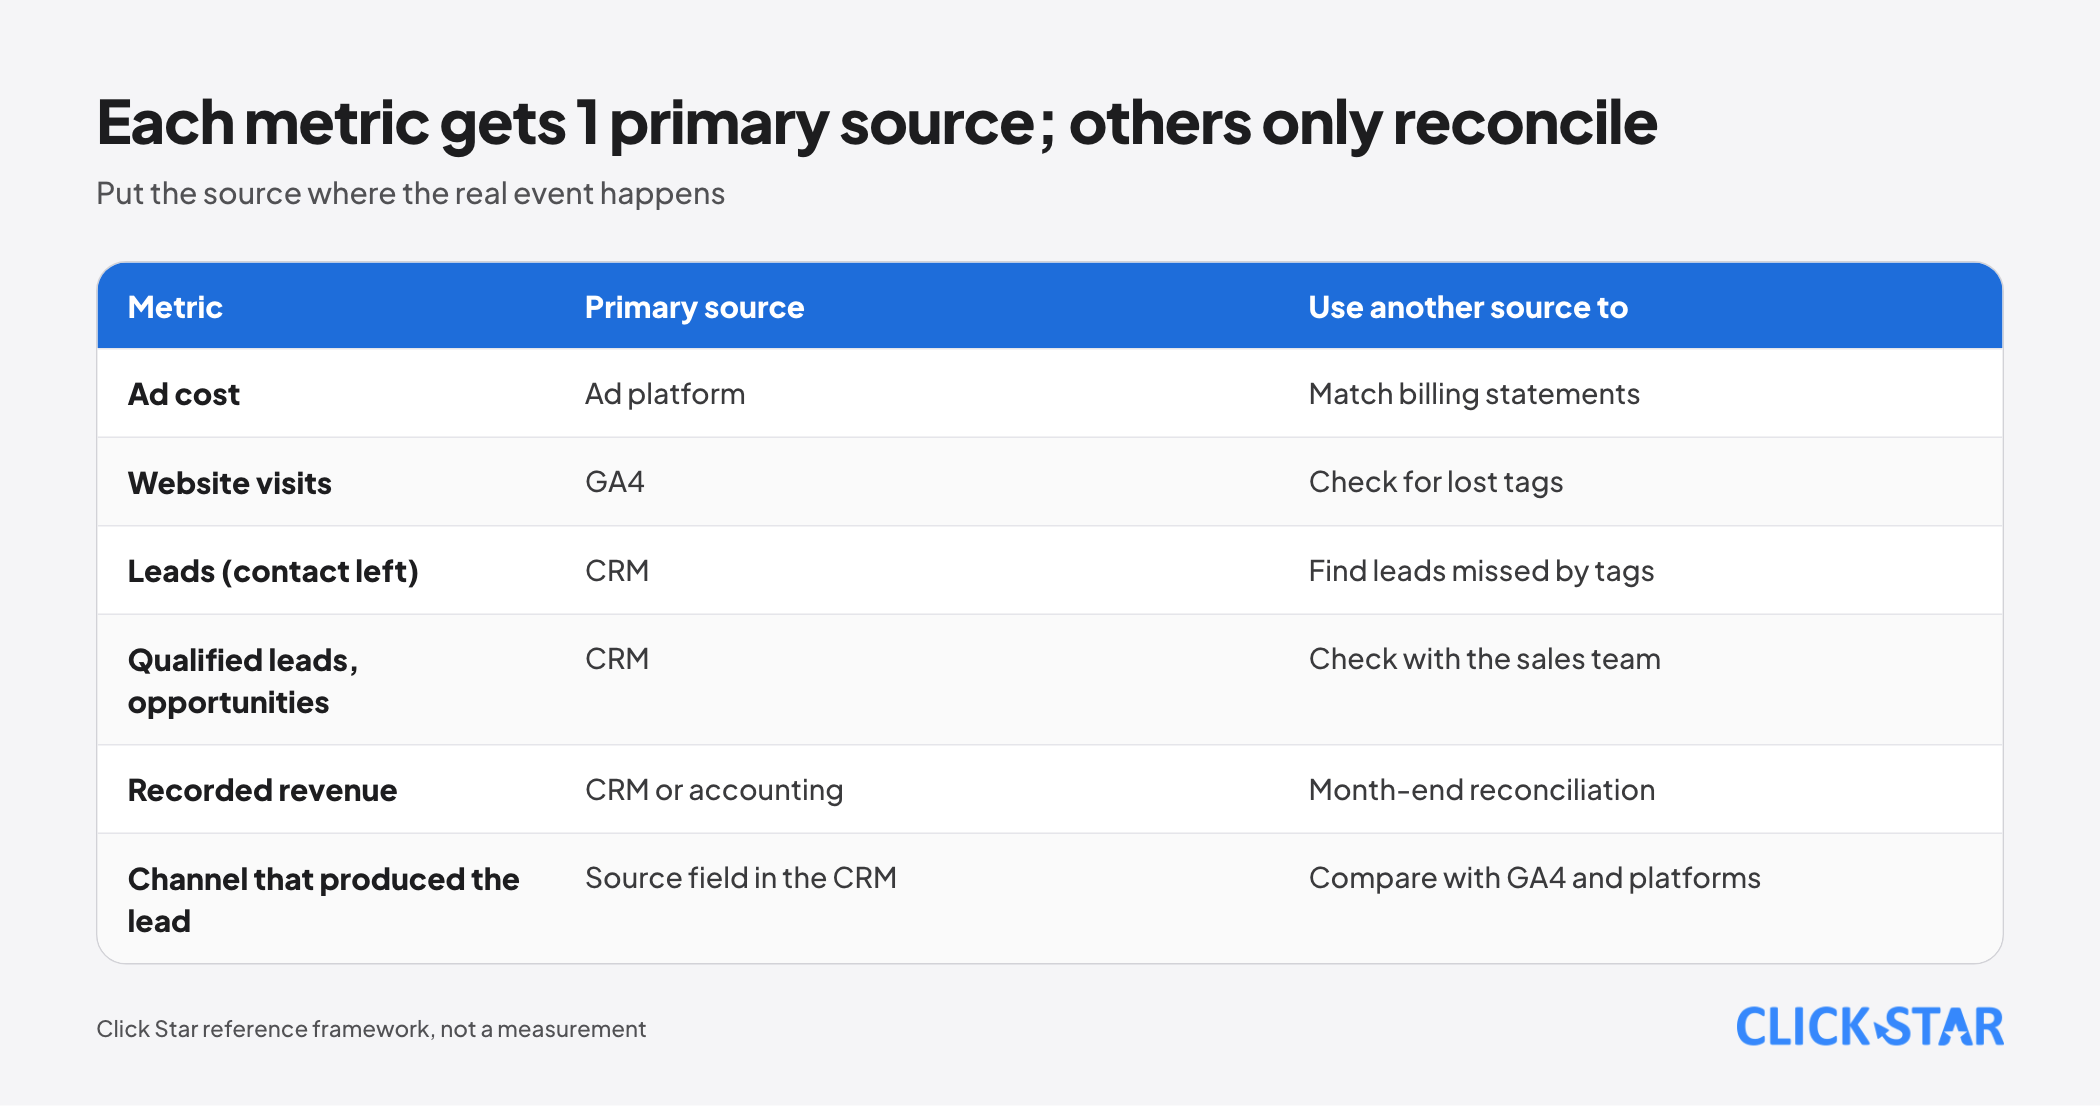
Do not add up conversions across platforms, because 1 customer can be credited by several. When two sources differ beyond a threshold the business sets itself, log a measurement risk instead of picking the more comfortable number.
Event log and exception alerts
Some weeks numbers move because of your own actions, not the market. Each line has a date, an event and the affected number: campaign start or stop, large budget change, form or landing page change, measurement incident, attribution or time zone change, holiday, CRM downtime.
According to "Analytics Insights", GA4 has custom insights: up to 50 per property, evaluated hourly, daily, weekly or monthly, with optional email and a "has anomaly" condition where GA4 sets the threshold. It covers GA4 data only, not CRM or ad cost.
Click Star suggests flagging 3 exceptions: lost measurement (leads or sessions at 0), spend over the cap, and a large move in 1 headline number. A flagged tile needs 1 line saying whether the cause is known.
According to "About data thresholds", GA4 can withhold rows when user counts are too low in reports with demographics, so small age or gender slices do not belong here.
The 15-minute meeting and what to leave out
The report goes out first, so the meeting is short. Click Star's frame: 3 minutes for the conclusion, 5 for gaps and exceptions, 5 for decisions, 2 to lock actions. Do not re-read every tile; record decisions in block 4 next week.
A leadership report filters for decisions rather than dumping numbers; detail stays in the underlying report.
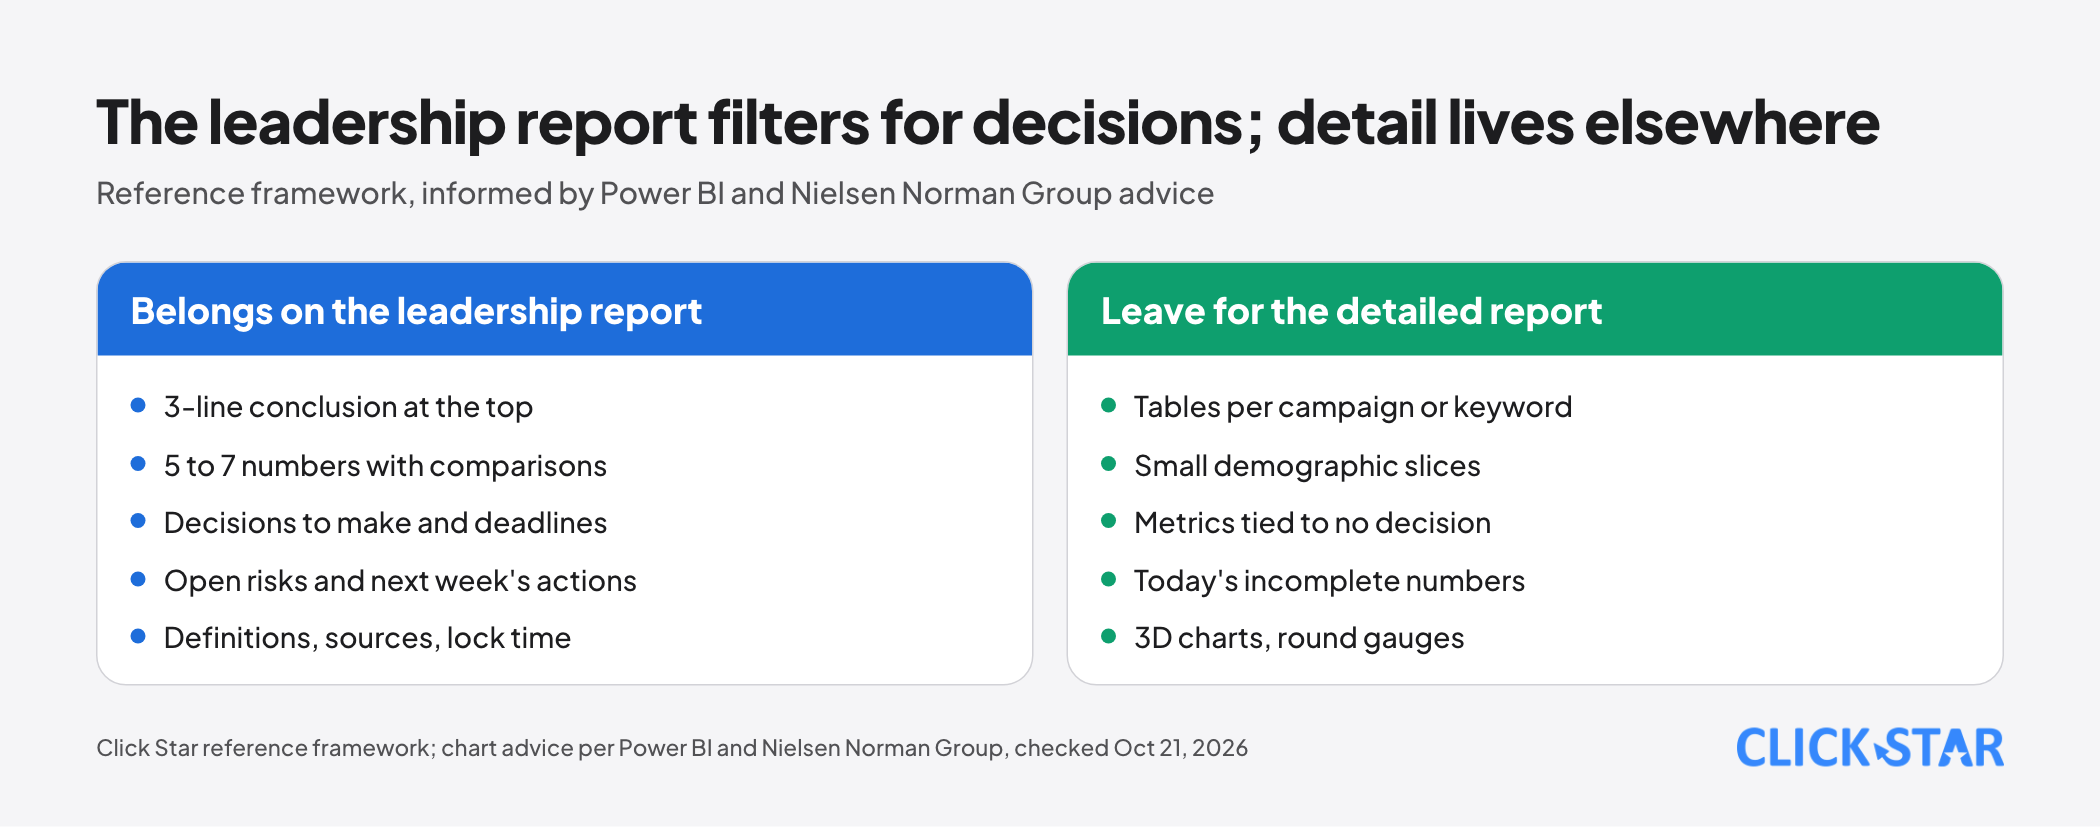
Leave for the detailed report: tables per campaign or keyword, small demographic slices, metrics tied to no decision, today's incomplete numbers and 3D or round-gauge charts.
Click Star's view. Disclosure: Click Star offers a data dashboard service, publicly described as visualizing business data and automated reporting. The frame works with GA4, Looker Studio, Power BI or a spreadsheet.
The hardest part of a weekly report is agreeing on sources and definitions, not charts. Until then, a beautiful report only produces arguments about numbers.
What to do: a 4-week plan
- Week 1: choose 5 to 7 numbers, assign 1 source of truth each, write a 1-line definition and an owner.
- Week 2: build the 6-block frame in the tool you already use, set comparisons with last week and last year, fix the lock time.
- Week 3: run alongside the old report, reconcile gaps, start the event log and alerts.
- Week 4: hold the real 15-minute meeting, ask which tiles go unused, cut the extras.
To measure the report, per Click Star's framework: weekly preparation time, corrections after sending, and decisions made in the meeting. Click Star has no external reference level, so record from week 1.
Common mistakes
- Stuffing every number into the report instead of choosing 5 to 7 tied to decisions.
- Leaving the conclusion at the end, so a top-of-page reader learns nothing.
- Locking numbers inside the 24 to 48 hour processing window, then silently replacing them.
- Using several sources for 1 metric, or adding up conversions across platforms.
- Not printing definitions, sources and lock time on the report itself.
- Skipping the event log, so every movement is blamed on the market.
- Re-reading numbers in the meeting instead of making decisions.
What is not known
Click Star has no independent measurement of effective report rhythm or length for leadership at Vietnamese businesses, nor of the gap between GA4, ad platforms and the CRM in Vietnam. The 6-block frame, lock schedule and 15-minute meeting are untested proposals.
Click Star could not open Meta Business Help Center pages (the tool returned titles only), so the article gives no detail on Meta attribution. Search results only show that Meta has pages on its attribution setting and on event count differences; check them in your ad account.
The "typically up to 20%" gap is Google's description, not an acceptable threshold. GA4 pages show no update date, and Click Star has no industry threshold for alerts.
Related posts
Need tailored advice for your business?
Click Star helps you build a solution that fits your industry and scale. We answer every question during business hours.