Do ads bring orders or just take credit? Test with a holdout
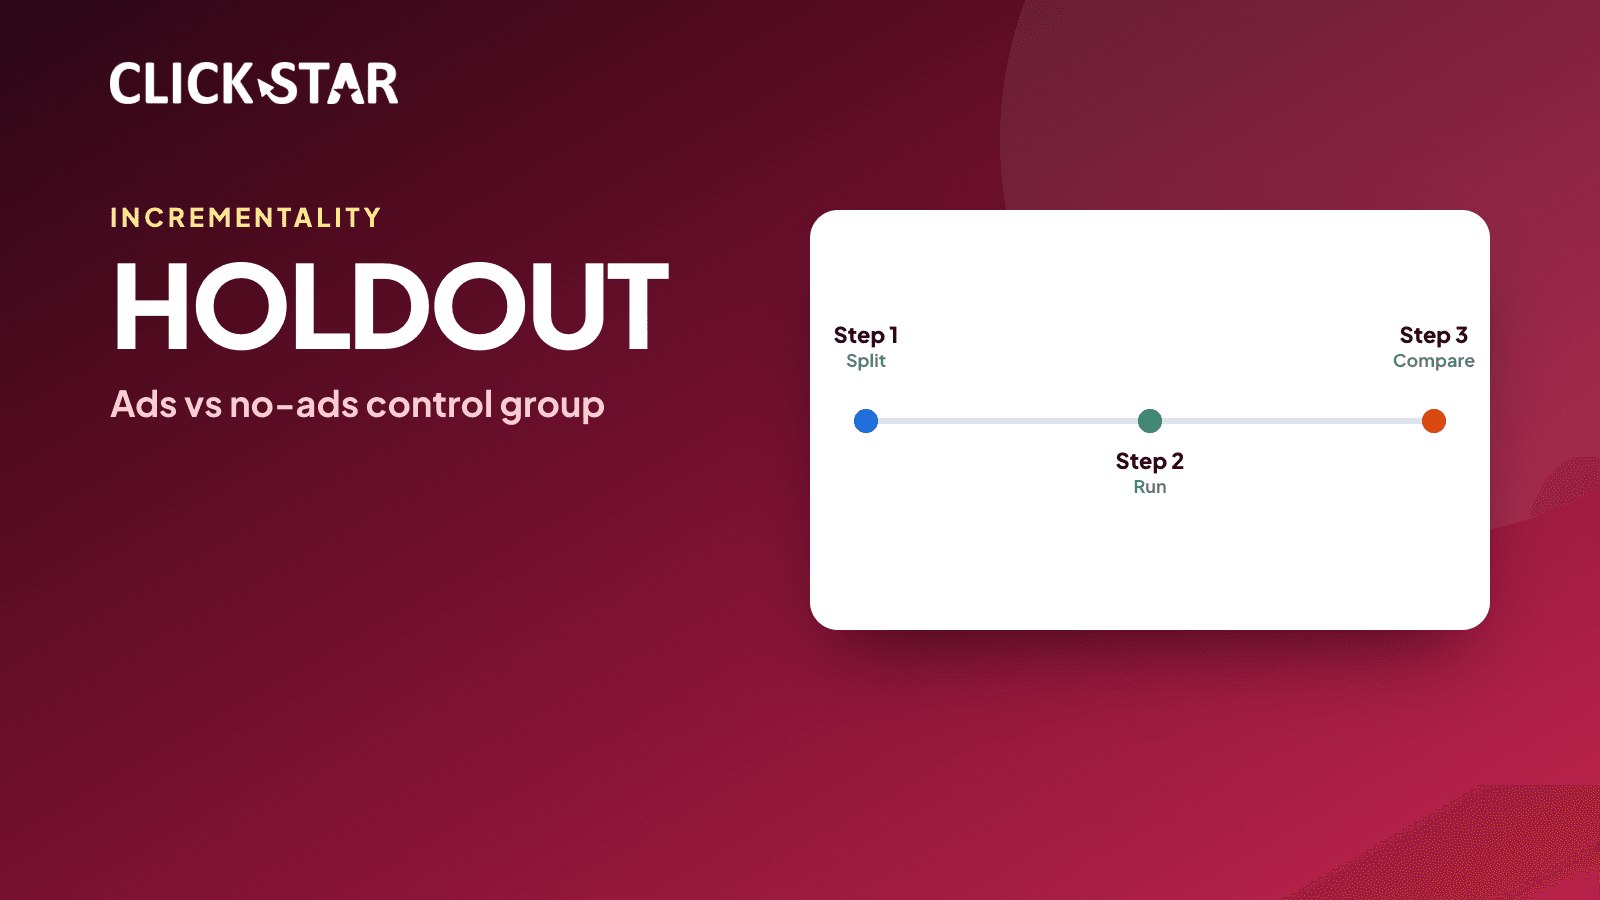
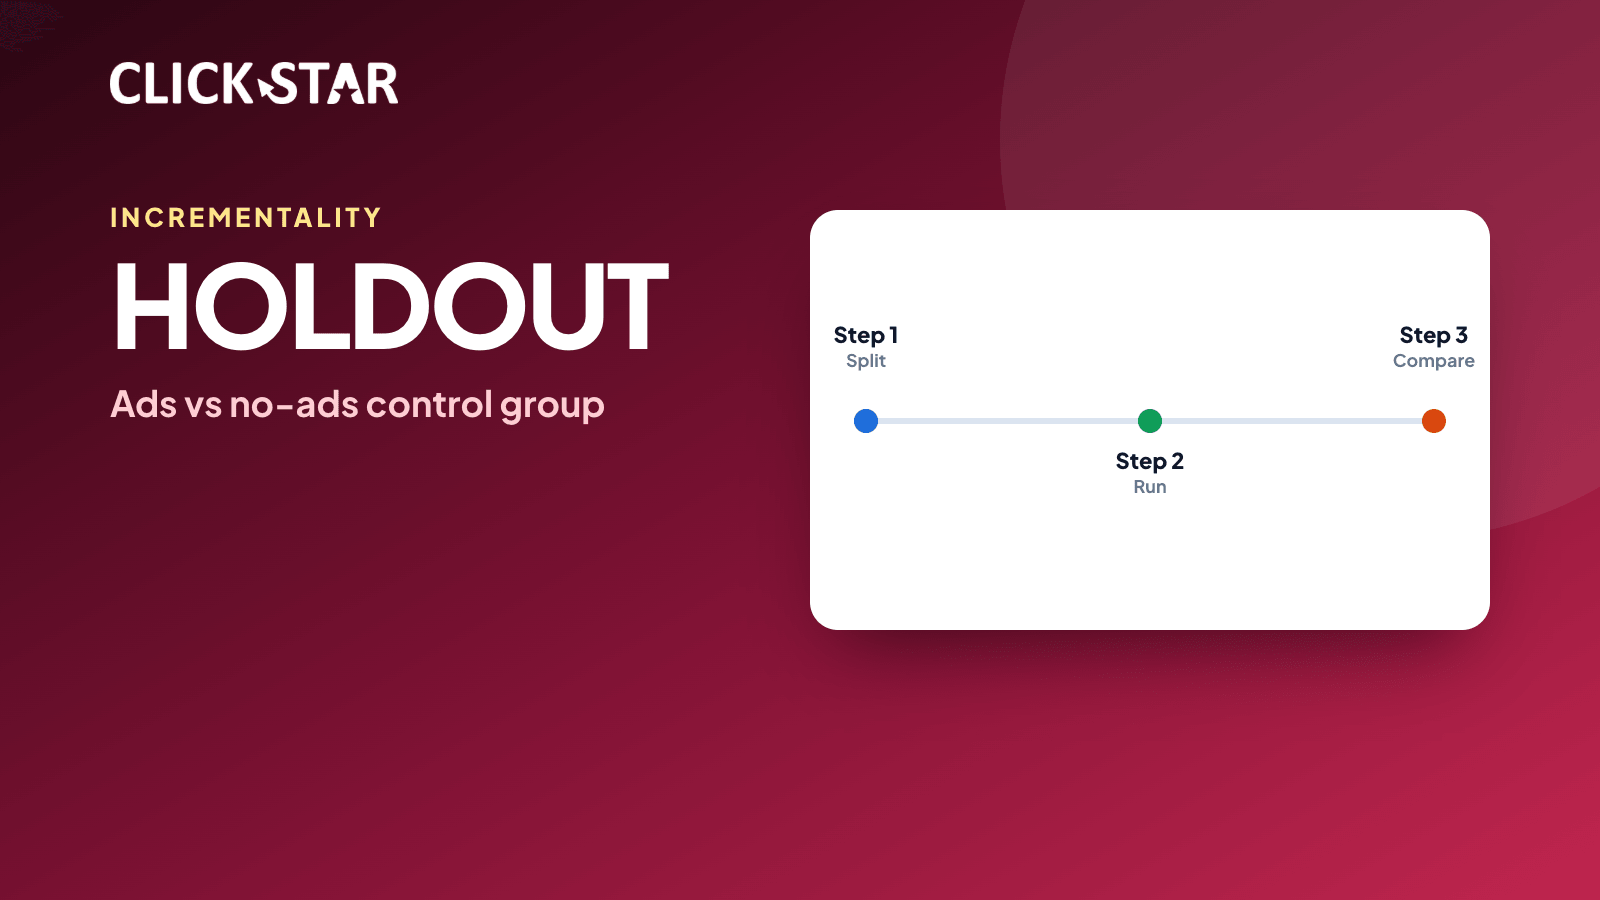
Ad platforms report the orders they credit to ads, yet customers may buy even without seeing them. The article explains control groups and the lift tools from Meta and Google, with a made-up worked example.
An online shop spends 60 million VND on ads in a month. The platform report shows 300 orders from ads, but the owner suspects many of those customers would have bought anyway. This is an illustrative example, not a real measurement.
This article draws on documents from Google (Think with Google, Google Ads Help, Google Research), Meta's API documentation and the NIST statistics handbook, checked on November 4, 2026.
The article answers 1 question: how can you tell whether ads create extra orders, using a control group. Click Star already has articles on ROAS (revenue divided by ad cost), LTV and CAC, on why GA4 and Meta Ads report different numbers, and on landing-page A/B tests.
Key points
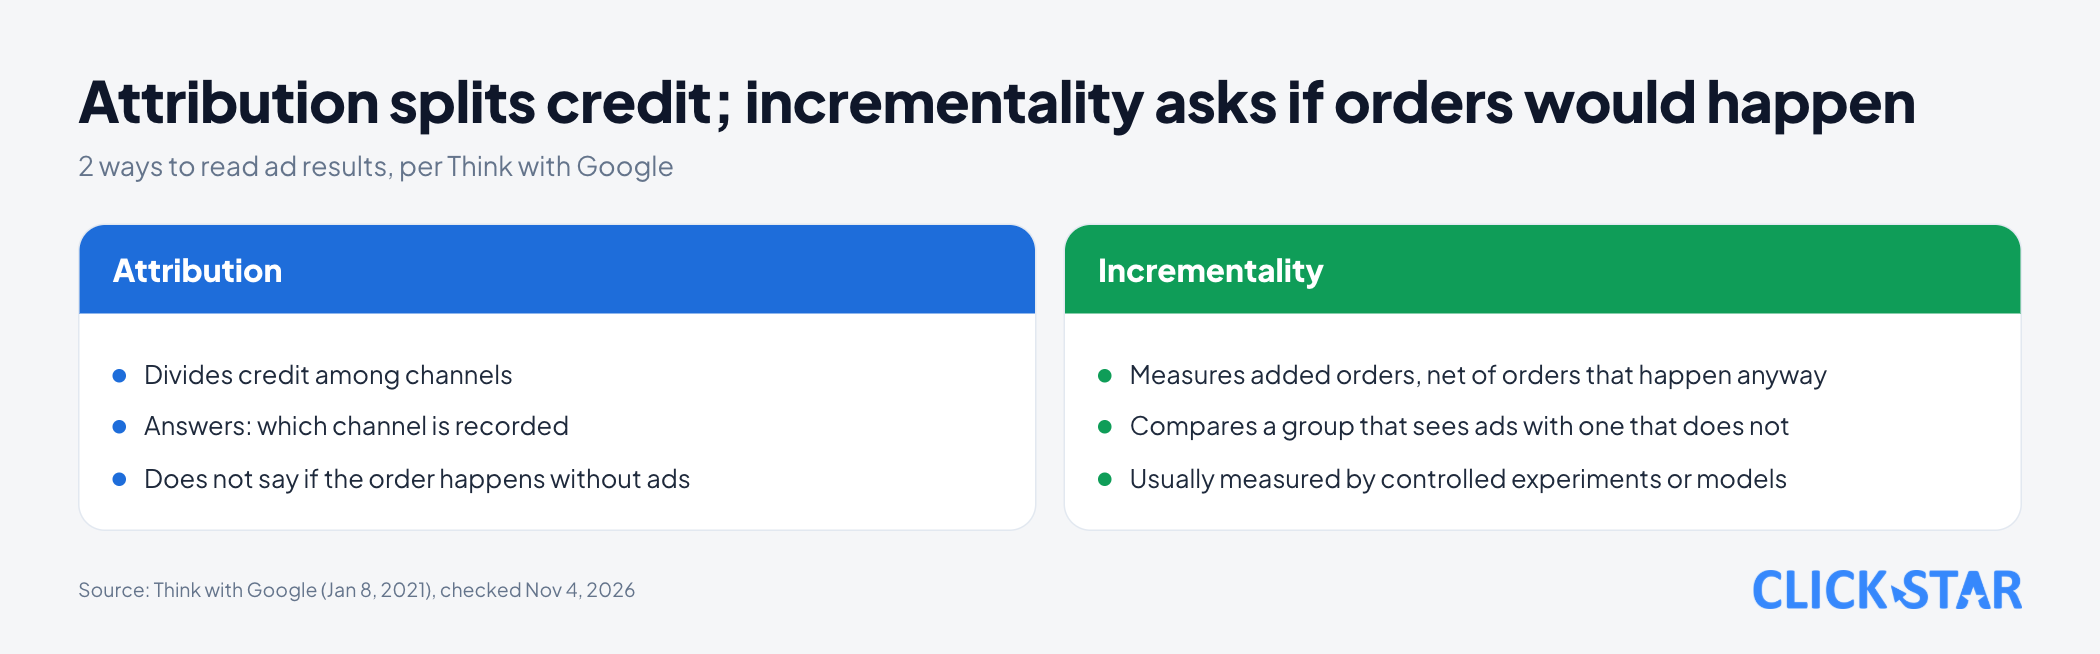
- Incrementality measures the conversions that ads add. Per Think with Google (January 8, 2021), it asks how many conversions would have happened anyway without ads, unlike attribution, which only divides credit among channels.
- In Click Star's view, the most direct method is a controlled experiment: randomize, show ads to 1 group, hold them back from another, then compare. Think with Google notes that a user-level test measures incrementality within 1 channel, not across channels.
- The official tools from Meta and Google both require contacting the company's representative. Google lists conditions for the user-based type: at least 1,000 conversions and a campaign budget of at least USD 5,000.
- A geo experiment splits by region rather than by person. Google Ads Help says this kind of split is noisier.
- A small business can hold back a random part of its customer list, but a small sample gives a wide confidence interval (the range the true value likely falls in): in the illustrative example, 16,000 versus 4,000 people give -8 to 168 extra orders.
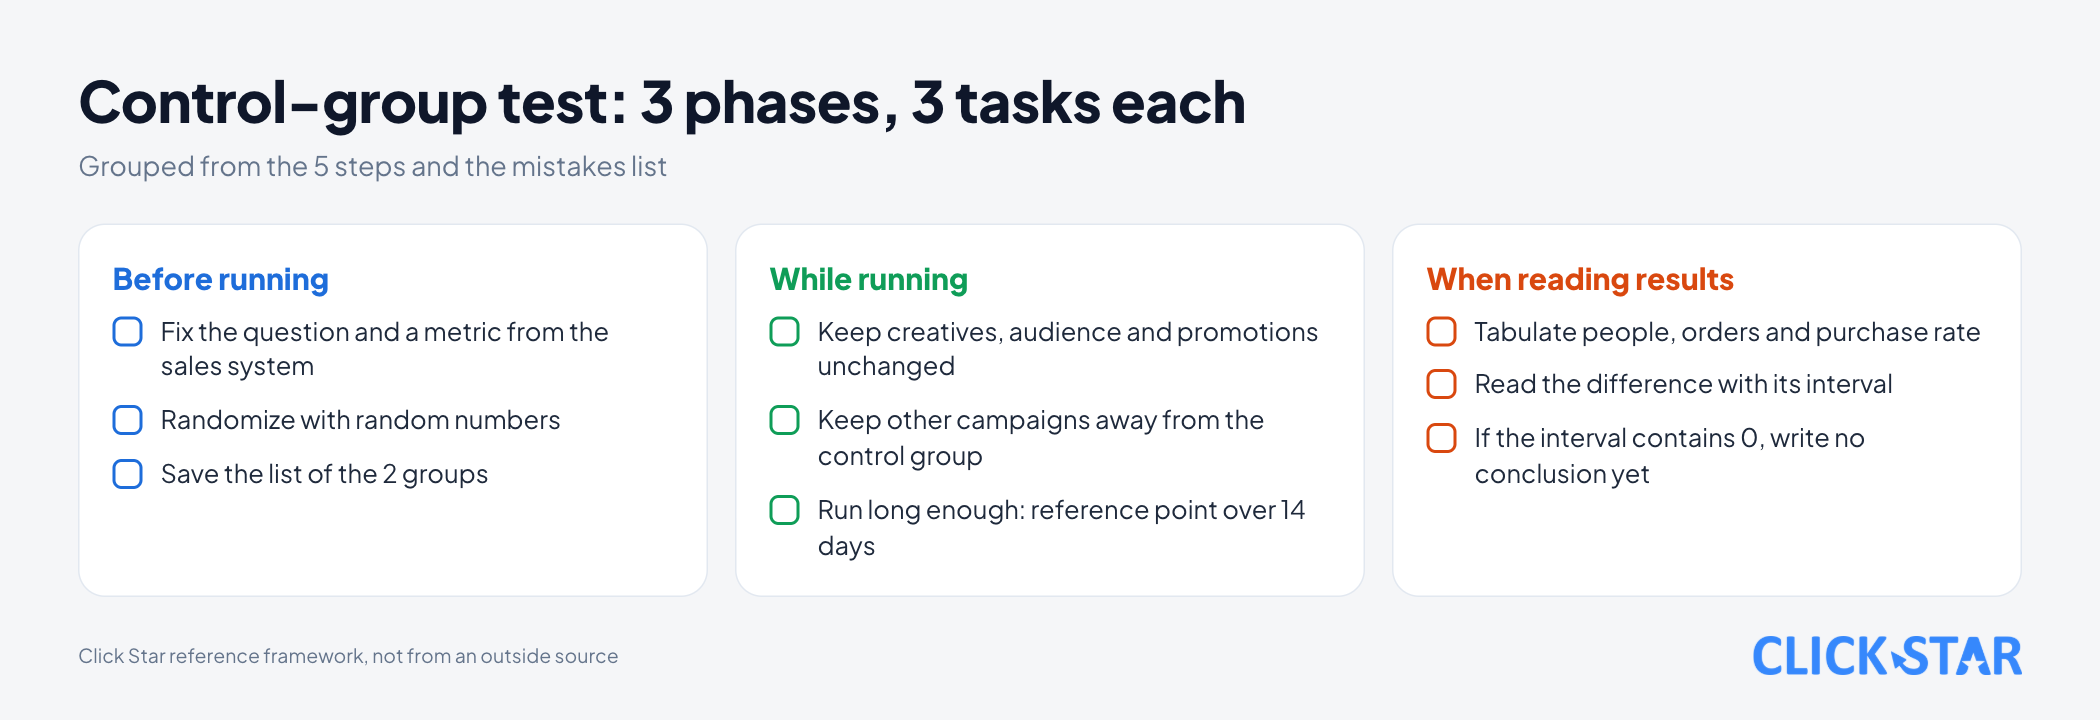
- Click Star's 5-step framework (not from an outside source): fix the question, randomize, keep everything else unchanged, run long enough, read the difference with its confidence interval.
What it means when ads take credit
Attribution answers "which channel gets recorded", not "would this order have happened without the ad". The Think with Google article "Want to improve your measurement? Get a grip on incrementality" (Avinash Kaushik, January 8, 2021) says the 2 ideas are different things.
An everyday example: a customer adds an item to the cart, sees a reminder ad and buys. The report credits the ad with 1 order, though the customer already meant to buy.
The sources read do not say what share of orders "would have happened anyway", and Click Star found no measurement for Vietnam. The only way to know is to measure.
How a control group works
A control group (or holdout) is a randomly chosen group that does not see the ads; the test group sees them as usual. Per the Google Ads Help page "About Conversion Lift" (no date shown, read November 4, 2026), the difference in conversions between the 2 groups is the lift.
Meta's developer document "Lift Study" (no date shown, read November 4, 2026) describes a randomized experiment in which Meta assigns Accounts Center accounts to a test group or a control group.
Click Star's view (basic statistics, not quoted from the sources above): with random assignment the 2 groups are alike on average, even in things that cannot be measured, such as buying intent. Comparing customers who happened to see ads with those who did not is less reliable: the groups may differ from the start.
Only 1 thing should differ between the 2 groups: whether ads are shown. Google's page "Set up Conversion Lift based on users" (no date shown, read November 4, 2026) warns that changing creatives or audiences mid-study can affect results.
Official tools from Meta and Google
Both companies have built-in tools, but not for every account. Meta's documentation says the feature is currently limited and requires contacting a Meta representative; Google Ads Help says the same.
On Meta, results compare conversions, accounts that converted and sales between the 2 groups. The start time and test share cannot be changed once the study runs. Breakdown results need at least 100 conversions, test and control groups combined.
Google has 2 types. According to "Comparing lift types" (no date shown, read November 4, 2026), the user-based type reports by age, gender and country, but can have measurement gaps. The geography type can measure offline purchases, but it is noisier, cannot be sliced by demographics and usually needs a higher budget.
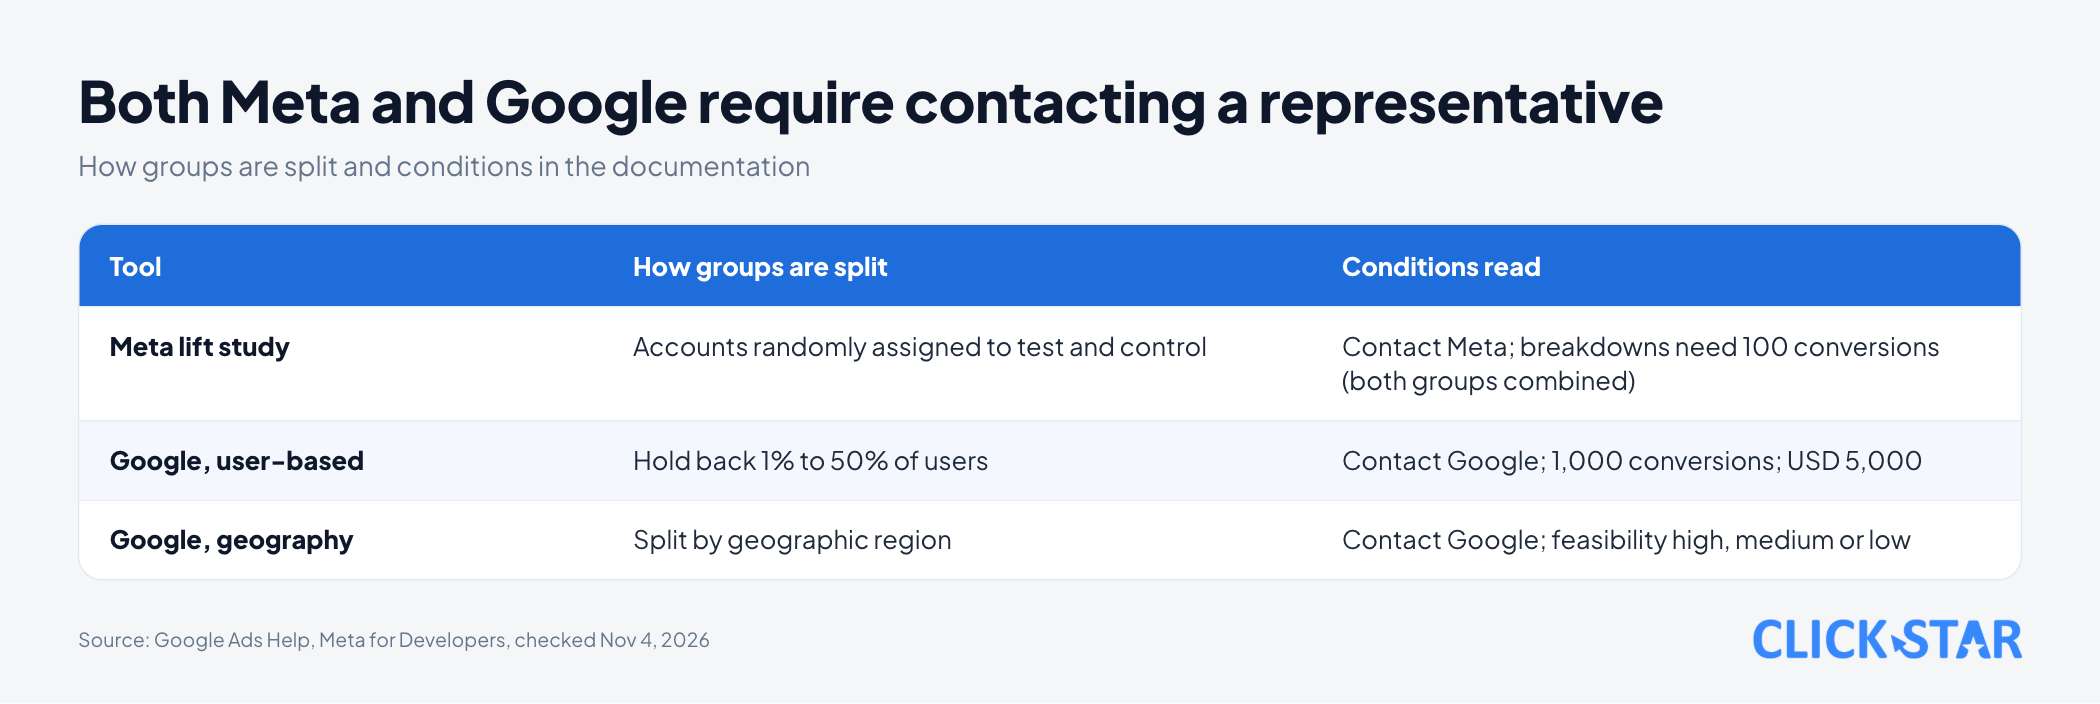
Conditions for the user-based type, per "Set up Conversion Lift based on users" (read November 4, 2026):
- At least 1,000 observed conversions (those with supplementary data do not count) and a campaign budget of at least USD 5,000.
- A holdback from 1% to 50%. People in the holdback can still see ads from campaigns outside the study.
- A study can be as short as 7 days; Google typically recommends more than 14 days.
- Certainty of lift (Google calls it study power) is shown from 50% to 95%; Google advises aiming for 90%, and says 50% to 90% is only directional.
The geography type has other conditions. The page "Set up Conversion Lift based on geography" (no date shown, read November 4, 2026) gives no minimum budget or fixed number of days. Setup shows a feasibility rating of high, medium or low and advises against running when it is low.
The geography type is still in beta, offers only holdback and go-dark studies, and campaigns must target a single country.
Geo experiments: the idea and the limits
A geo experiment randomly assigns regions to a test or control group, then uses region-targeted ads to create that condition. The Google Research blog (December 9, 2011, Lizzy Van Alstine and Jon Vaver) describes it this way.
The weak point is the number of regions. A 2017 paper by Jouni Kerman, Peng Wang and Jon Vaver (Google Research, no exact date shown) says the geo-based regression model is less applicable or not applicable with few geographic units, and proposes time-based regression. The case of 1 test region against 1 control region is called a matched-market test.
Worked example with made-up numbers
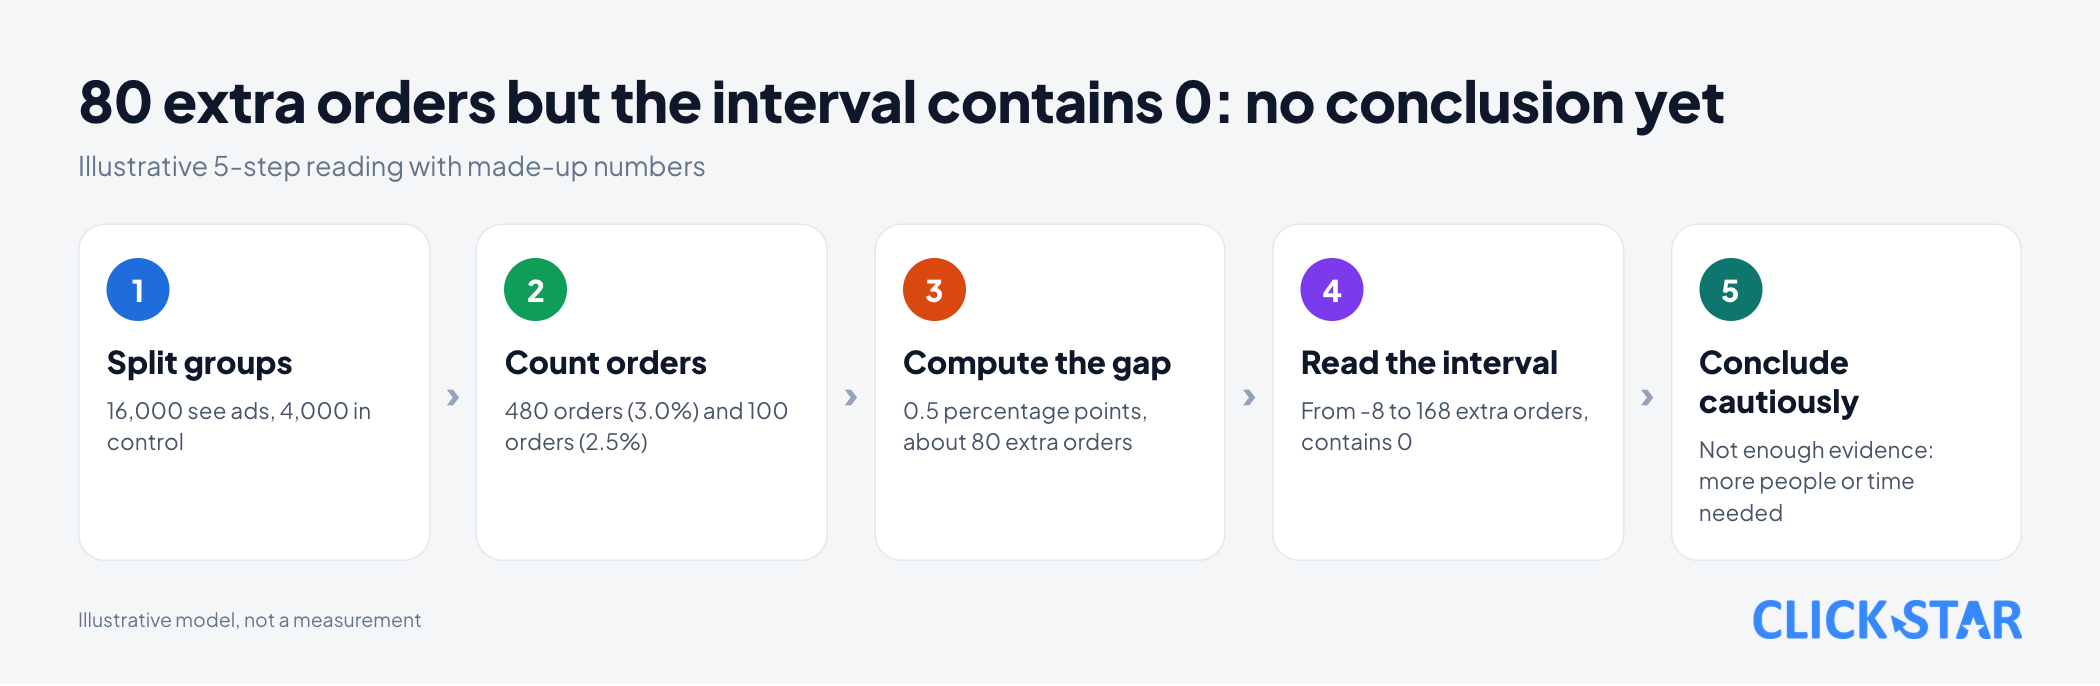
An illustrative example, not a measurement. A list of 20,000 past customers is split at random: 16,000 see the ads, 4,000 are excluded from the campaign. Ad cost is 60 million VND and the average order is worth 500,000 VND.
The group that saw ads has 480 orders, or 3.0%. The control group has 100 orders, or 2.5%; scaled to 16,000 people that is 400 orders. The gap is 0.5 percentage points, about 80 extra orders, while the platform credits the ads with 300 orders.
Extra revenue is 80 times 500,000 VND, or 40 million VND; divided by 60 million VND, incremental ROAS (counting only the revenue ads add) is about 0.67. The platform-reported ROAS is 300 times 500,000 VND divided by 60 million VND, or 2.5. Revenue is not profit.
But 80 is only a point estimate. Click Star calculates the 95% confidence interval for the difference of the 2 rates as -0.05 to +1.05 percentage points, or -8 to 168 extra orders.
This interval contains 0. The z test for 2 proportions in the NIST handbook (section 7.3.3, no date shown, read November 4, 2026) gives a two-sided p of about 0.09. The correct conclusion is not enough evidence yet, not that the ads are useless.
More people narrow the interval: at the same rates, 4 times the sample (64,000 and 16,000 people) gives a 95% interval of +0.22 to +0.78 percentage points.
With an 80/20 split, Click Star's own calculation (normal approximation) needs about 40,000 test and 10,000 control people to detect this gap, at 95% confidence and 80% statistical power (not Google's study power).
Limits and risks
The first risk is contamination of the control group. Google notes that people in the holdback can still see ads from campaigns outside the study, so measuring only some of your campaigns lowers the chance of detecting lift (users setup page).
Next is reading results early. The page "Understand your Conversion Lift based on users measurement data" (no date shown, read November 4, 2026) advises waiting until the study ends for the most accurate results.
Last is generalizing. Think with Google notes that, at portfolio level, results can look contradictory: billboards useless one year, effective the next. In Click Star's view, 1 measurement also answers only for the campaign and period measured.
What a small business can do
A Click Star framework, not from an outside source, and not yet tried on real data. There are 3 ways, ordered from more to less trustworthy.
Way 1. Hold back a random part of the customer list. For a campaign aimed at past customers, split the list with random numbers in a spreadsheet and upload only the test part, if the platform lets you exclude a list from the audience. Other campaigns must not reach the held-back group.
Way 2. Switch off by region. Pick provinces with similar sales and turn ads off in the control group. With few regions analysis is hard, as the geo experiments section above explains.
Way 3. Switch off for a period. Turn ads off for a few weeks and compare with the previous period. This is not random, so seasonality and promotions skew the result; treat it as a weak signal.
With every way, compare real orders in the business's own sales system or CRM, not the ad platform's numbers.
What this means for Vietnamese businesses
Click Star found no public document saying whether Meta's or Google's lift tools are open to small accounts in Vietnam. With a small budget, the practical route is to design the control group yourself.
Click Star's view. A control group is the most direct way to test your belief in a platform report, but it cannot replace the report. It answers for 1 campaign in 1 period.
With a small sample, the result is often "not enough evidence": run longer or combine campaigns before cutting budget. Click Star sells digital marketing, data dashboard and CRM services, so it has an interest in this topic.
What to do: the 5-step framework
A Click Star framework, not an industry standard.
Step 1. Fix the question and the metric. For example: "how many extra orders does the past-customer campaign create". Pick 1 metric taken from the sales system.
Step 2. Randomize. Use random numbers in a spreadsheet and save the list of the 2 groups.
Step 3. Keep everything else unchanged. Do not change creatives, audience or promotions midway.
Step 4. Run long enough. Google's reference point is more than 14 days; extend it if the buying cycle is longer.
Step 5. Read the difference with its confidence interval. Tabulate people, orders and purchase rate for each group; then compute the difference, interval and incremental ROAS (from the extra orders and ad cost). If the interval contains 0, write "no conclusion yet".
Common mistakes
- Comparing sales before and after switching ads off and drawing a conclusion, ignoring seasonality and promotions.
- Splitting groups by gut feeling, such as putting good customers in the test group, instead of random numbers.
- Letting the control group still see ads from other campaigns without knowing.
- Changing creatives, audience or budget heavily midway.
- Stopping the test as soon as the midway numbers look good.
- Reading only the point estimate and ignoring a confidence interval that contains 0.
- Applying the result of 1 campaign to every campaign and every year.
What is not known
It is unclear whether Meta's and Google's lift tools are open to small accounts in Vietnam. Meta's budget conditions could not be read because its Help Center blocks tools.
There is no measurement for Vietnam of the share of orders that still happen without ads. The figures 480 orders, 100 orders, the range from -8 to 168 orders and the sample sizes 40,000 and 10,000 are illustrative or self-calculated.
It is unclear whether Way 1 works on every platform, since Click Star has not checked each platform's option to exclude a list.
Related posts
Need tailored advice for your business?
Click Star helps you build a solution that fits your industry and scale. We answer every question during business hours.