GA4 redefined bounce rate, so how do you read engagement rate?
Explains engagement rate and bounce rate in GA4 per Google documentation: how they are counted, how to add them to reports, the 10-second threshold and a 4-step reading framework.
A visitor lands straight on the Contact page, sees the phone number, calls right away and closes the tab after 8 seconds. Under GA4's definition, that session counts as "not engaged" unless the call is measured as a key event (an important action you mark yourself), though the visitor did what the business wanted.
This article draws on Google's Analytics Help and developer documentation, plus 1 secondary article from Analytics Mania, checked on November 4, 2026. It covers GA4 only.
The short answer: bounce rate still exists in GA4, but it is a different measurement from Universal Analytics and should be read together with engagement rate. Click Star already has articles on events and key events in GA4, UTM and cohorts.
Key points
- Per Google, bounce rate in GA4 is the percentage of sessions that were not engaged, the inverse of engagement rate. The 2 add up to 100%.
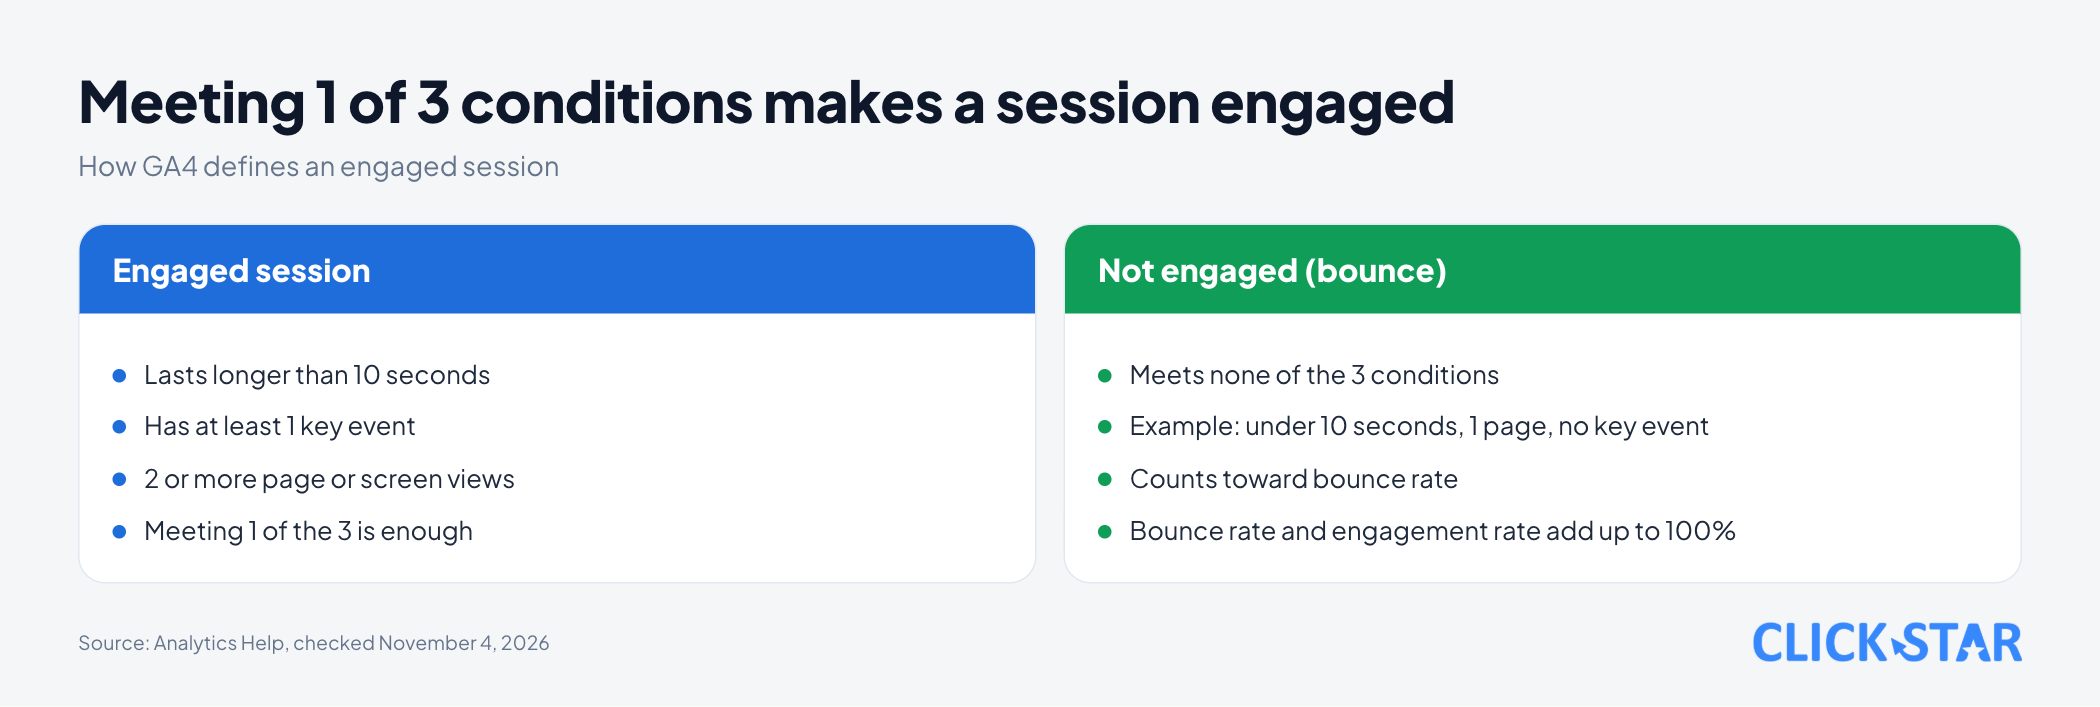
- A session is engaged when it meets at least 1 of 3 conditions: it lasts longer than 10 seconds, has a key event, or has 2 or more page or screen views.
- Most GA4 reports do not show these 2 metrics by default. An Editor or Administrator must add them to a detail report.
- The 10-second threshold can be changed in the tag settings of a web data stream. Raising it tends to push bounce rate up (Click Star inference from the definition).
- A 1-page session is not automatically a bad page. A Contact page can count as not engaged despite meeting its goal, if the action is not yet measured.
- Click Star uses no "industry standard" threshold because the Google pages read give none. A 4-step framework helps compare by source and landing page.
What engagement rate and bounce rate mean in GA4
Engagement rate is the percentage of sessions that were engaged, and bounce rate is the percentage that were not. According to the GA4 page "Engagement rate and bounce rate" (no date shown, read November 4, 2026), both metrics are built on the engaged session.
A session is a visit to a website or app. According to "About Analytics sessions" (no date shown, read November 4, 2026), a session ends by default after 30 minutes of inactivity.
According to "Analytics dimensions and metrics" (no date shown, read November 4, 2026), engagement rate is engaged sessions divided by total sessions, and bounce rate is not-engaged sessions divided by total sessions.
How an engaged session is counted
Meeting any 1 of 3 conditions is enough. The page "Engagement rate and bounce rate" lists them: the session lasts longer than 10 seconds, or has a key event, or has 2 or more page or screen views.
Google's example: a user reads for under 10 seconds and leaves, with no event and no other page. If that is the only session, engagement rate is 0% and bounce rate is 100%.
According to "About key events" (no date shown, read November 4, 2026), any event can become a key event, but you must mark it. Click Star infers that ordinary clicks or scrolls do not by themselves make a session engaged (an inference from the definition, not Google's wording).
Google's pages give the threshold slightly differently: "longer than 10 seconds" on the engagement rate page, "10 seconds or longer" on "Analytics dimensions and metrics". The events first_visit, first_open and session_start are excluded from engaged sessions even if marked as key events (per "Engagement rate and bounce rate").
How GA4 bounce rate differs from Universal Analytics
Universal Analytics (UA, the earlier version of Google Analytics) counted bounces by pages. According to the legacy UA page "Bounce rate" (no date shown, read November 4, 2026), a bounce is a session with a single request to the Analytics server, such as opening 1 page and leaving.
The same page says bounce rate is available in the Audience Overview, Channels, All Traffic and All Pages reports. GA4 changes the idea: a bounce is a session that meets none of the 3 conditions above.
The page "Comparing metrics: Google Analytics vs. Universal Analytics" (no date shown, read November 4, 2026) gives an example: a visitor views the home page for several minutes without clicking, and UA counts a bounce. Its GA4 example is under 10 seconds, also a bounce. Click Star infers from the GA4 definition that a multi-minute session lasts over 10 seconds, so it is not a bounce.
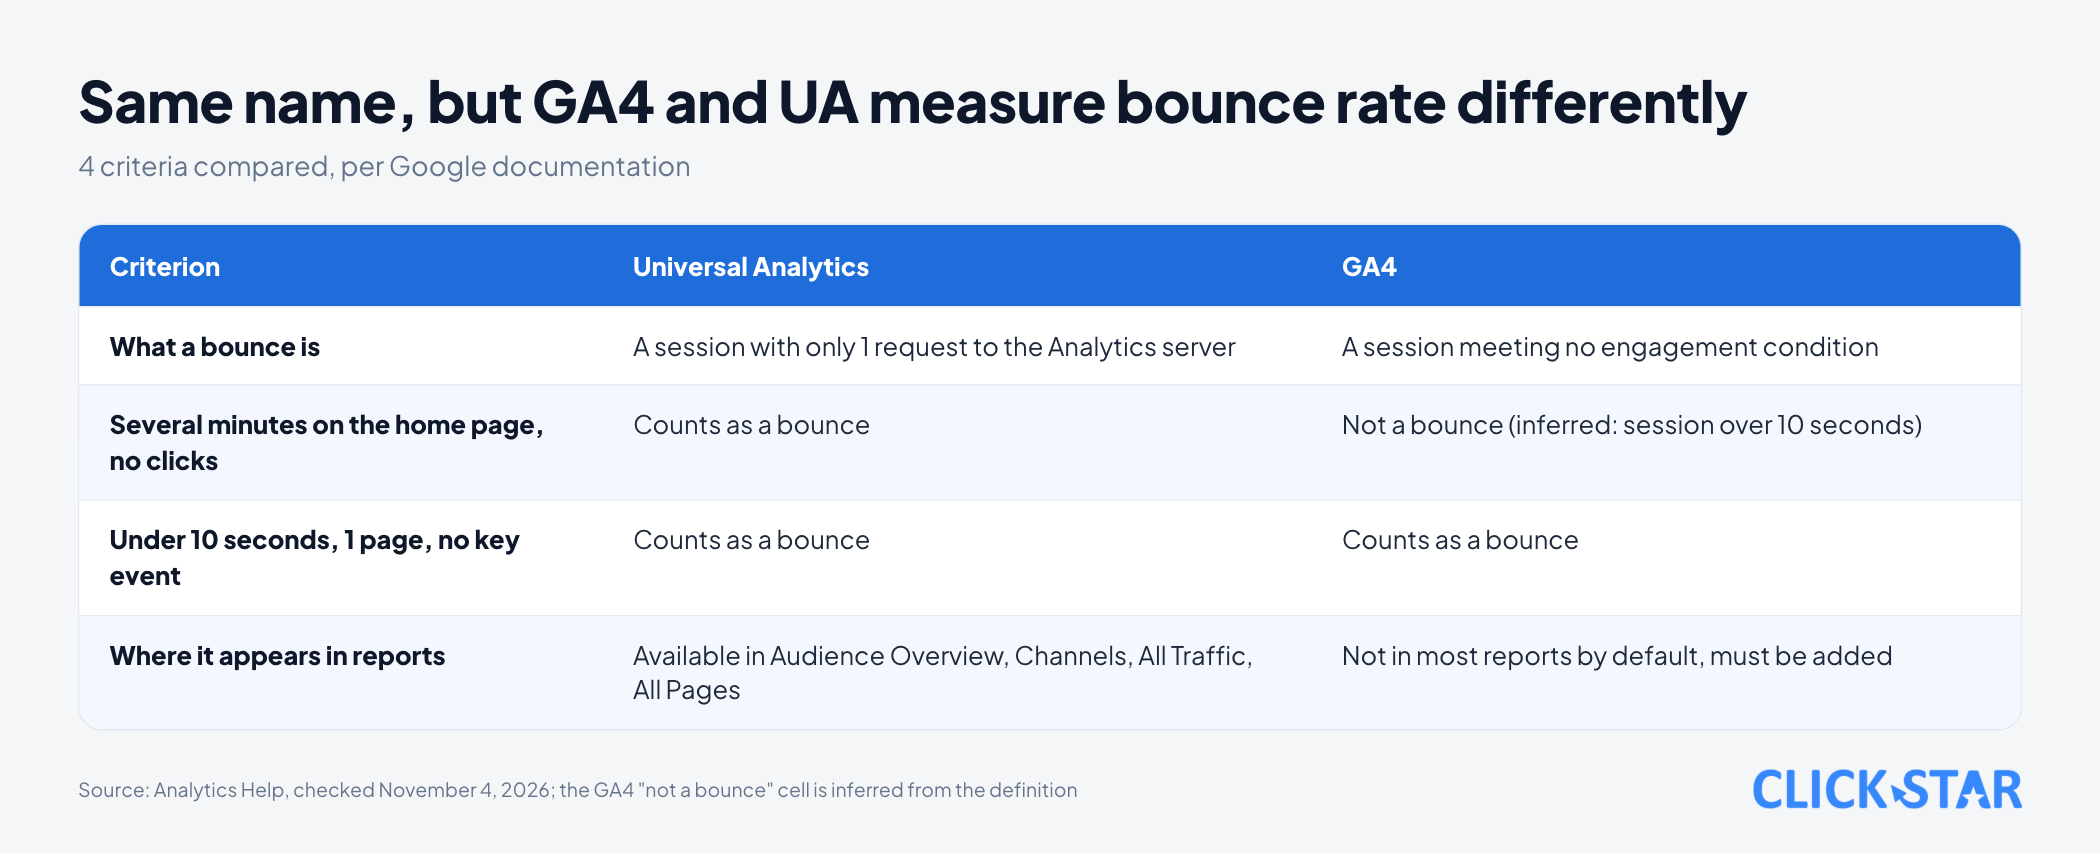
Click Star's view, inferred from the 2 definitions: do not set GA4 numbers beside old UA numbers to conclude "better" or "worse", because they measure different things.
What engagement time measures, and how to read it with engagement rate
Engagement time measures how long the page is in the active tab. According to "User engagement" (no date shown, read November 4, 2026), it is the time the web page is in focus in the browser, or the app screen is in the foreground.
GA4 records it in the engagement_time_msec parameter, sent when the user switches tab, leaves the page or closes the window. Average engagement time is total engagement time divided by active users, per "Analytics dimensions and metrics".
Engagement rate answers "was the session meaningful"; engagement time answers "how long did the visitor stay".
Why bounce rate is missing from reports, and how to add it
Per Google, most reports do not include these 2 metrics by default. You need the Editor or Administrator role, and can add them only to detail reports, not overview reports.
Per the page "Engagement rate and bounce rate": open a detail report (for example Pages and screens), choose Customize report, Metrics, Add metric, type "Engagement rate" or "Bounce rate", Apply, then save.
The Traffic acquisition report (read November 4, 2026) already lists Engagement rate. The help page for the Landing page report (read November 4, 2026) does not list this metric, so add it manually.
Can the 10-second threshold be changed
Yes, and per the documentation it sits in the settings of a web data stream. According to "About Analytics sessions", go to Admin, Data streams, pick the web stream, Configure tag settings, Show all, then Adjust session timeout. The "Adjust timer for engaged sessions" field lets you choose the number of seconds.
The Google pages read give no allowed range. Analytics Mania (secondary source, updated January 4, 2025) writes that it can go up to 60 seconds; Click Star has not checked this against Google.
A higher threshold means fewer sessions meet the time condition, so bounce rate tends to rise. Click Star found no Google page saying whether the change covers old data, so record the date and do not compare numbers before and after it.
Is a 1-page session a bad page
Not necessarily. The page "Comparing metrics" says that if you run a blog, you may not mind a visitor reading 1 article and leaving. The bigger worry is visitors who find nothing useful and leave fast.
An illustrative example, not a measurement. A Contact page may show a low engagement rate because visitors call quickly. For a long guide, if the visitor reads past 10 seconds, the session is still engaged.
To avoid judging the Contact page unfairly, mark the wanted action as a key event. The page "Enhanced measurement events" (no date shown, read November 4, 2026) lists form_start, form_submit and file_download, but under the engaged-session definition they help only when marked as key events.
Comparing sources and landing pages with engagement rate
Use it to compare, not as an absolute target. When the rate is low, Google suggests checking whether it is low everywhere or only for a few channels, source/medium pairs or pages.
When comparing by page, use the landing page. The document "Measure sessions and user engagement" (updated October 26, 2026, read November 4, 2026) says sessions by page path include every session that visited the page, so summing rows can exceed the true total. To see landing traffic, Google recommends "Landing page + query string".
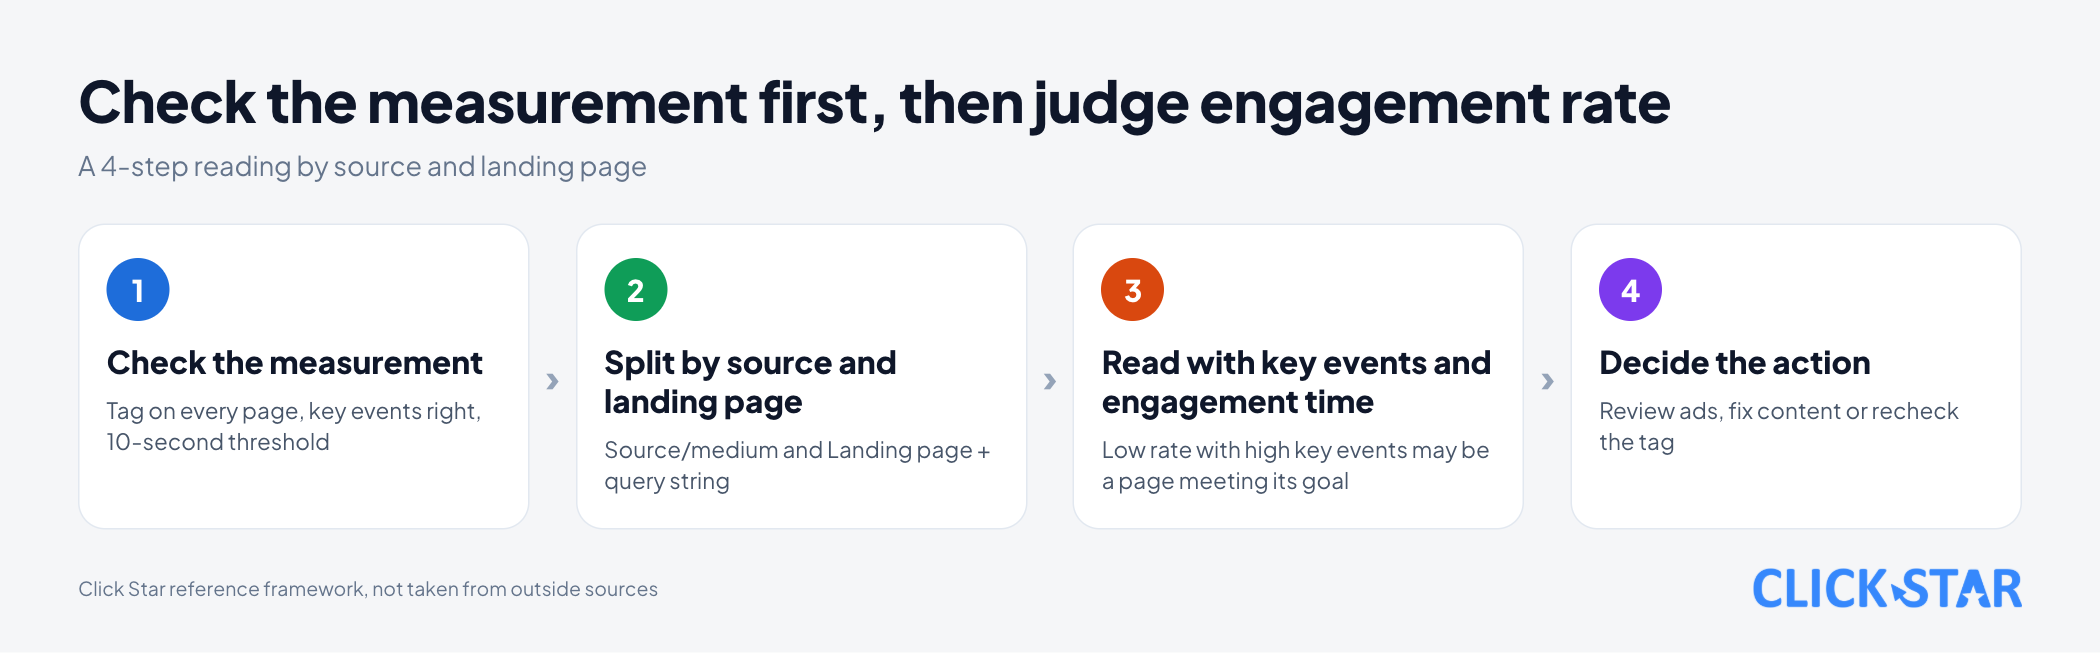
Click Star's 4-step reading framework
This is Click Star's reference framework, not taken from outside sources and not yet tested on real data.
Step 1. Check the measurement. The tag is on every page, key events match the goals, and the engaged-session threshold is still the default or has been changed.
Step 2. Split by source and landing page. Read engagement rate by source/medium and by "Landing page + query string", over the same period.
Step 3. Read with key events and engagement time. Low engagement rate with high key events may be a page that meets its goal fast, not a broken page.
Step 4. Decide the action. Low for 1 source: review the ads or audience. Low for 1 landing page: fix the content or the next step. Low everywhere: recheck the tag.
Risks that distort the numbers
When engagement rate is low across the board, Google suggests checking that every page is tagged and tagged correctly (page "Engagement rate and bounce rate").
Google advises against generic "ping" events sent only to keep a session open, as they inflate engagement rate artificially (page "Measure sessions and user engagement"). For long reads or views without clicks, that page points to meaningful progress events that stop when the tab is hidden.
What this means for Vietnamese businesses
Click Star found no public measurement of engagement rate for Vietnamese websites, so the article gives no "good" or "bad" level.
Click Star infers from the definition: if visitors call, message on Zalo or fill a form right on the landing page and that action is not a key event, engagement rate will underrate the page.
Click Star's view. Engagement rate is a useful comparison measure when the measurement is stable and key events reflect real goals. It should not be the only number reported: pair it with key events and engagement time, by source and landing page.
Changing the 10-second threshold is a data governance decision, so record the date and the reason. Click Star offers data dashboards and digital marketing services, so it has an interest in this topic.
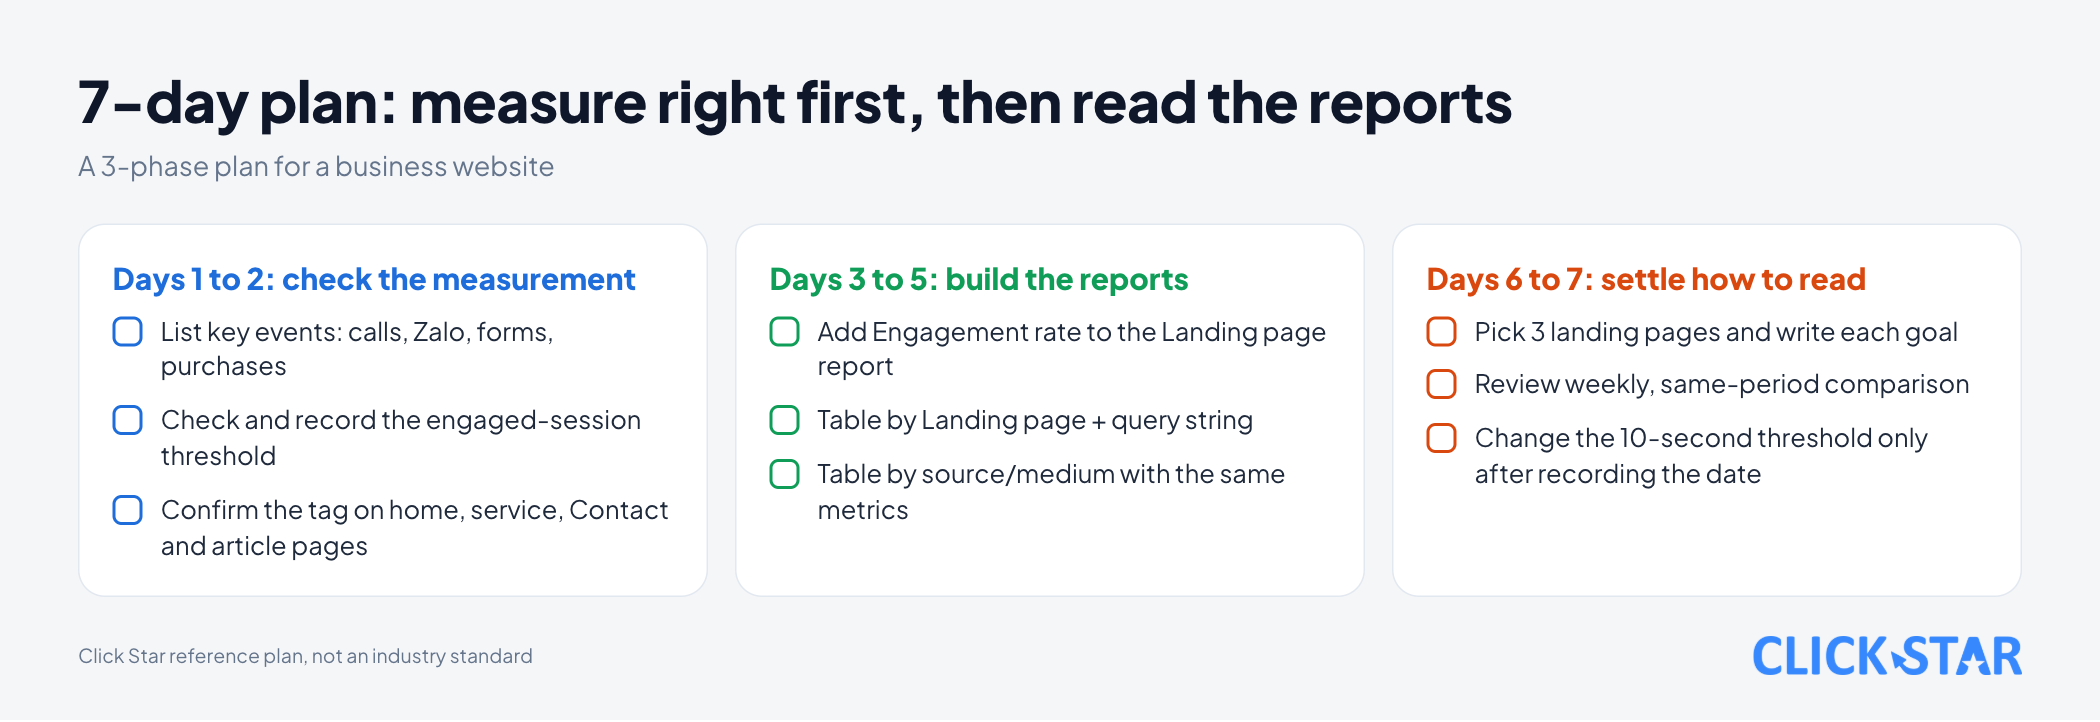
What to do: a 7-day plan
This is a reference plan from Click Star, not an industry standard.
Days 1 to 2: check the measurement
- List current key events and match them to goals: calls, Zalo, forms, purchases.
- Check the current engaged-session threshold and record its value.
- Confirm the tag is present on the home page, service pages, the Contact page and articles.
Days 3 to 5: build the reports
- Add Engagement rate to the Landing page report.
- Build a table by "Landing page + query string" with sessions, engagement rate and key events.
- Build a table by source/medium with the same metrics.
Days 6 to 7: settle how to read
- Pick 3 key landing pages and write down each page's goal action.
- Schedule a weekly report review, comparing the same period.
- Set a rule: change the 10-second threshold only after recording the date.
Common mistakes
- Comparing GA4 bounce rate with old Universal Analytics numbers as the same measure.
- Treating low engagement rate as a broken page, even when the page has a quick goal such as a phone call.
- Forgetting to mark a key event for an important action.
- Changing the 10-second threshold and comparing with earlier periods without recording the date.
- Summing page-path rows to get a session count instead of using the landing page.
- Sending generic pings to keep sessions open and "improve" engagement rate.
- Copying a "good engagement rate" from a blog as the target for every website.
What is not known
It is not clear what range the "Adjust timer for engaged sessions" field allows (Google's page gives none; a secondary article says up to 60 seconds), or whether a change applies to old data.
It is not clear how "Average engagement time per session" is calculated: the Traffic acquisition page repeats the per-active-user formula. Whether the threshold is "longer than" or "10 seconds or longer" is also not consistent across pages.
There is no public measurement of engagement rate for Vietnamese websites. The 4-step framework has not been tested on real data.
Related posts
Need tailored advice for your business?
Click Star helps you build a solution that fits your industry and scale. We answer every question during business hours.