Lead scoring: how to build a scale, set the handover threshold for sales and validate it
How to build a lead scale with fit, engagement, negative points and decay, set the handover threshold for sales and validate it against real outcomes, based on HubSpot, Salesforce and Microsoft documentation.
A lead score is only useful when it predicts which prospects will buy. If points are added by gut feeling and the threshold is set by habit, the sales team soon stops trusting the number.
This article explains lead scoring, how to separate fit from engagement, how to set the handover threshold for sales, when to use machine learning and how to validate against real outcomes. Main sources: HubSpot, Salesforce and Microsoft documentation, checked on October 22, 2026.
Click Star already has articles on unifying customer data and on CRM; scoring is reliable only when each customer is one record.
Key points
- Lead scoring assigns points so sales knows whom to call first. A score has value only once compared with real outcomes: which leads became opportunities and which won.
- Separate 2 axes: fit (is this the right profile?) and engagement (are they interested?). HubSpot labels the 2 axes separately.
- Negative points and decay stop scores from only rising. HubSpot lets you set decay on a 1, 3, 6 or 12 month cycle.
- MQL and SQL are statuses, not numbers. Documentation shows thresholds only as illustrative examples and gives no standard number of points for an MQL; the 2 teams agree on the threshold.
- Machine learning needs enough leads with known outcomes. Minimums: Microsoft 40 qualified and 40 disqualified leads, HubSpot 50 contacts (25 converted, 25 not).
- Validate by grouping leads by score band, waiting for the sales-cycle lag, then comparing opportunity rates.
What lead scoring is, and how MQL differs from SQL
Lead scoring assigns each prospect a number to rank follow-up, built from who they are, what they did and how recently.
MQL (marketing qualified lead) and SQL (sales qualified lead) are 2 statuses in the customer journey. In HubSpot's lifecycle stage documentation (updated October 20, 2026), an MQL is a contact marketing has qualified as ready for sales, and an SQL is one sales has qualified as a potential customer.
Fit score, engagement score, negative points and decay over time
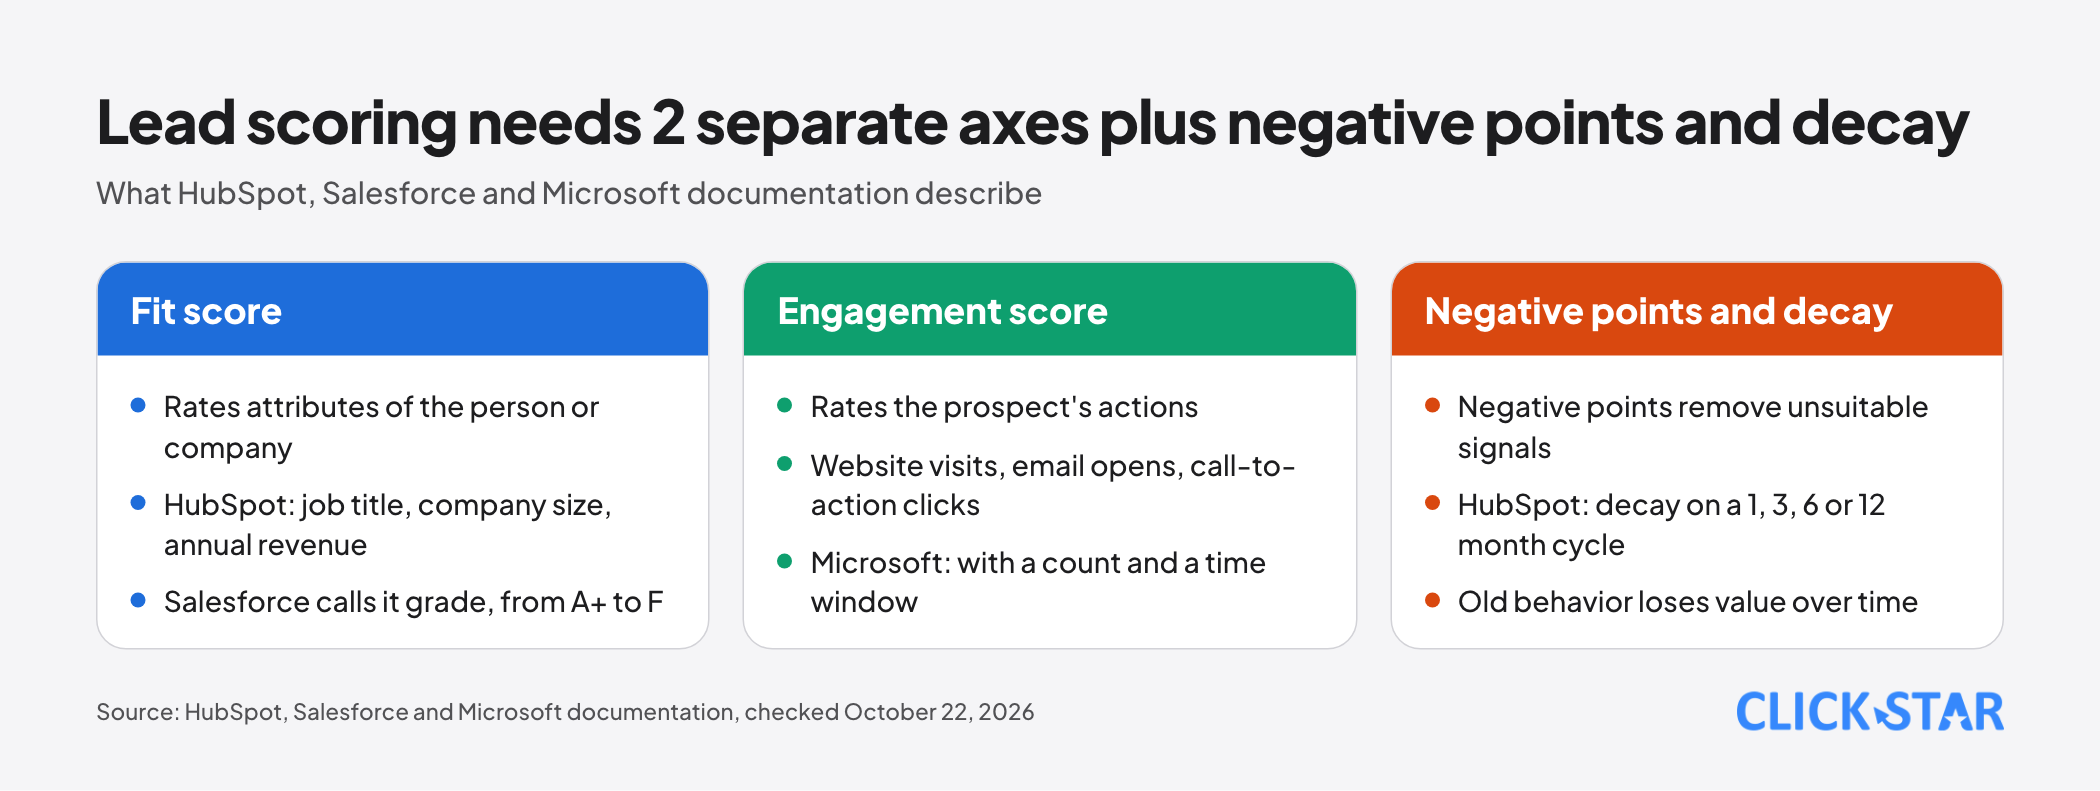
A fit score rates attributes of the person or company. According to HubSpot, examples are job title, company size or annual revenue.
An engagement score rates actions. HubSpot gives examples such as visiting the website, subscribing to a newsletter, clicking a call to action or opening an email. Microsoft allows a count and a time window, for example at least 5 emails opened in 28 days.
Keep the 2 axes separate: a student doing homework who views the pricing page many times can still push a score over the threshold.
Negative points remove unsuitable signals. HubSpot's example adds points for a matching industry and size and subtracts points for a region the company does not serve.
Decay over time makes old behavior lose value. According to HubSpot, decay applies per event on a 1, 3, 6 or 12 month cycle (each month is 30 days) and covers historical data. Example: a form worth 10 points with 50% decay per month is worth 5 after 1 month and 0 after another 30 days.
What HubSpot, Salesforce and Microsoft documentation say
HubSpot and Salesforce separate a fit score from an engagement score. Microsoft Journeys scores attributes and interactions inside one model, and grades are only optional score ranges.
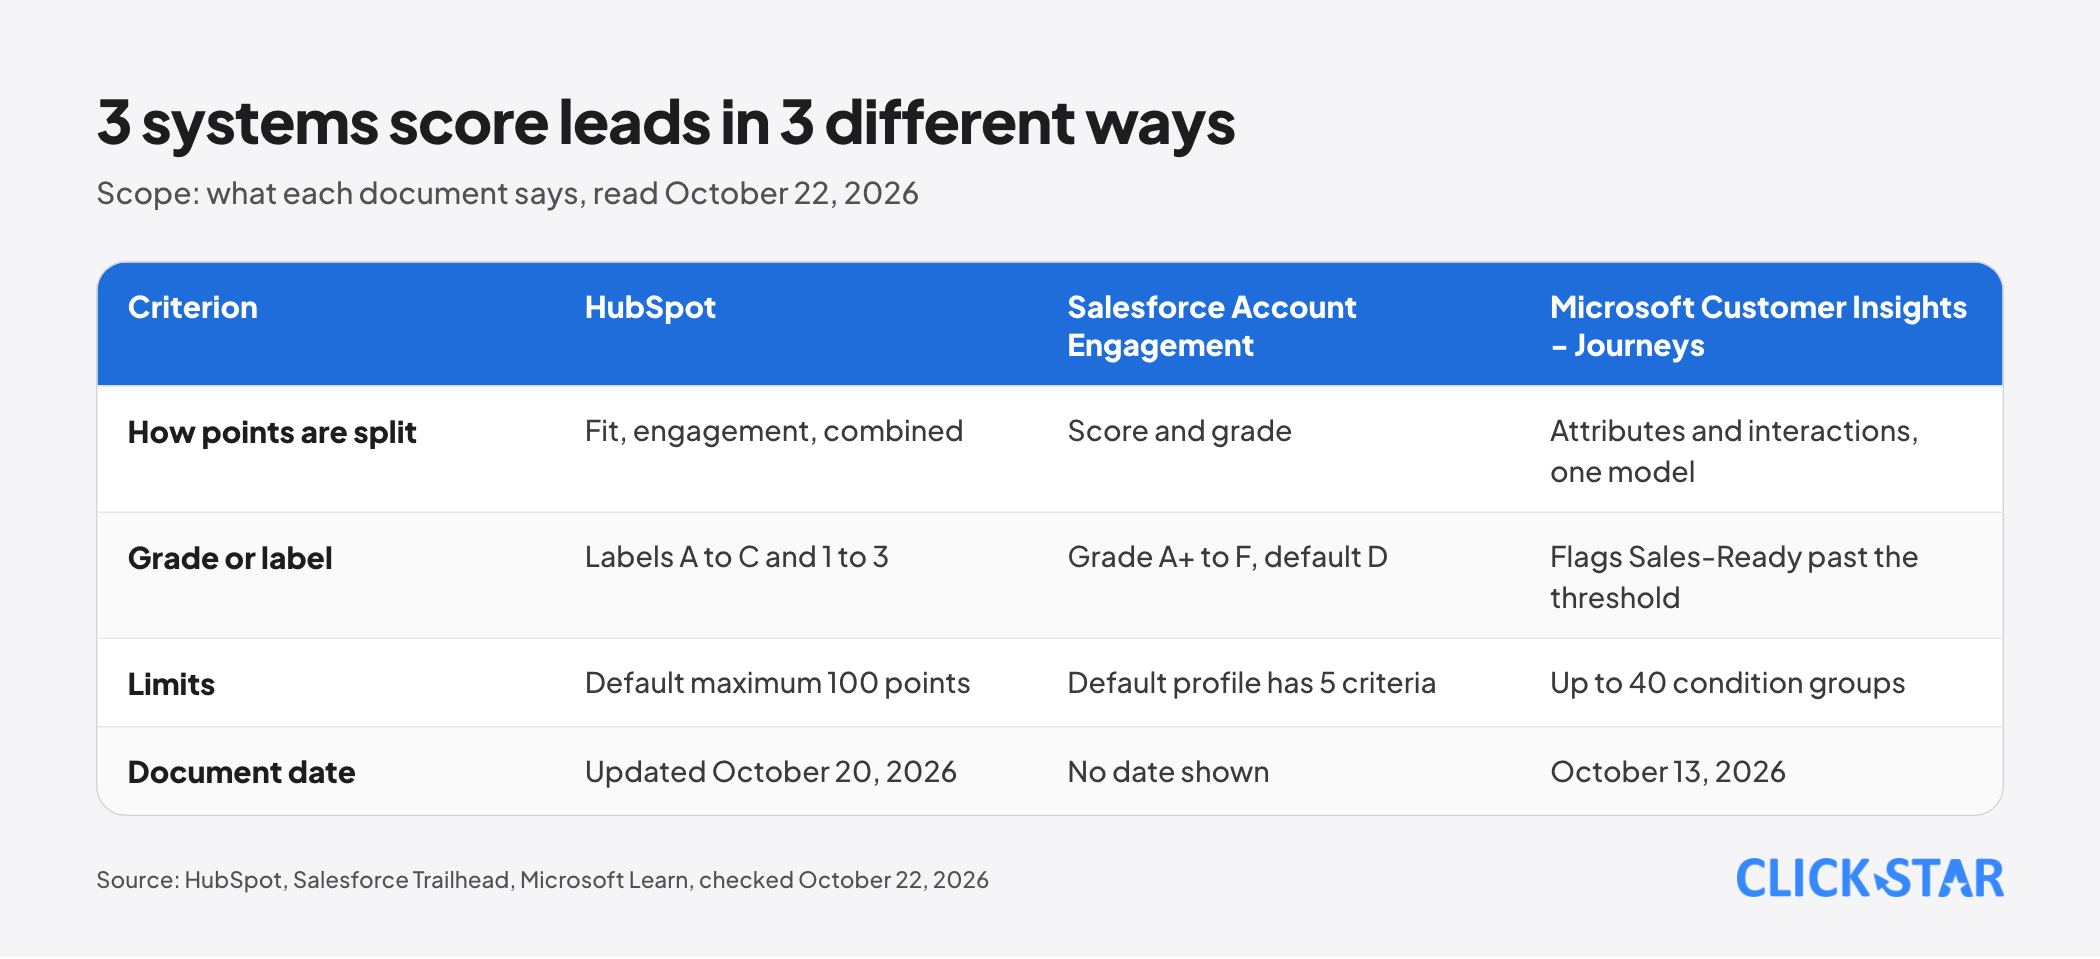
HubSpot (updated October 20, 2026, Professional or Enterprise plans) offers fit scores, engagement scores and combined scores. The default maximum is 100 points, and each rule group can have its own cap.
Thresholds create labels from A (high fit) to C (low fit) and 1 to 3 (high to low engagement).
Salesforce Account Engagement separates score (engagement) from grade (fit, from A+ to F). According to Trailhead, every prospect starts at grade D and the default profile has 5 criteria: company size, industry, location, job title, department. Trailhead is undated training material.
Microsoft Customer Insights - Journeys (October 13, 2026) scores on attributes and interactions, with positive or negative points, up to 40 condition groups per model.
When a score passes the qualification threshold, an open lead is flagged Marketing Qualified or Sales-Ready; one already Marketing Qualified keeps that status if its score later drops. After duplicates are merged, the primary record is not scored until the merged leads' scores are deleted or the model is republished.
A sample scale and the handover threshold for sales
This is a Click Star reference framework, not a measurement. There is no industry-standard score or threshold: the documents above give thresholds only as examples (HubSpot: a High band of 70 to 100 in a sample scenario). Calibrate every number against your own outcomes.
Fit score, maximum 30:
- Within the service area: +10
- Company size or budget in the target segment: +10
- Contact holds a decision or recommendation role: +10
Engagement score, maximum 70:
- Submits a quote request form or books a consultation: +30
- Calls or messages on Zalo to ask for a price: +20
- Views the pricing or service page in the last 7 days: +5 each time, up to 15
- Opens an email: +1 each time, up to 5
Negative points and related rules:
- Outside the service area: -20
- Wrong phone number or unreachable after 3 attempts: -15
- Employees, competitors, partners: excluded from scoring
- Engagement points halve after every 30 days without new activity
Handover threshold for sales, checked in this order:
- Submits a quote request form or books a consultation: always contacted, because the prospect asked directly
- Total of 60 or more and fit score of 20 or more: goes to sales
- Total of 60 or more but fit score below 20: stays in nurturing, sales reviews manually
- Total of 35 to 59: stays in nurturing
- Below 35: monitored only
Use a dual condition, not a plain sum, because a high total driven by behavior can hide a wrong-segment prospect.
Rule-based scoring or machine-learning prediction
Rule-based scoring is easy to explain and works with little data, but a person guesses the weights. Predictive scoring learns from past leads but needs enough won or lost leads.
Microsoft Dynamics 365 Sales requires at least 40 qualified and 40 disqualified leads, created and closed within a training window of 3 months to 2 years (document dated August 7, 2025). HubSpot requires at least 50 contacts, 25 converted and 25 not, for AI scores on Marketing Hub Enterprise (updated October 20, 2026).
The Salesforce Einstein Lead Scoring guide (Spring '23, April 20, 2023) states, for each lead segment, at least 1,000 leads created in 200 days and 120 converted to an account and contact. When all leads are scored together (no segments) with too little data, Einstein uses a global model from many Salesforce customers, so the score has not learned from your customers.
The sources do not claim these numbers suffice for a reliable model. Microsoft trains on 80% of closed leads and tests on the remaining 20%, the most recent records (document dated July 2, 2025).
How to validate a scale against real outcomes
Validation compares scores with real outcomes by score band, not by feeling. The 5 steps below are a Click Star reference framework.
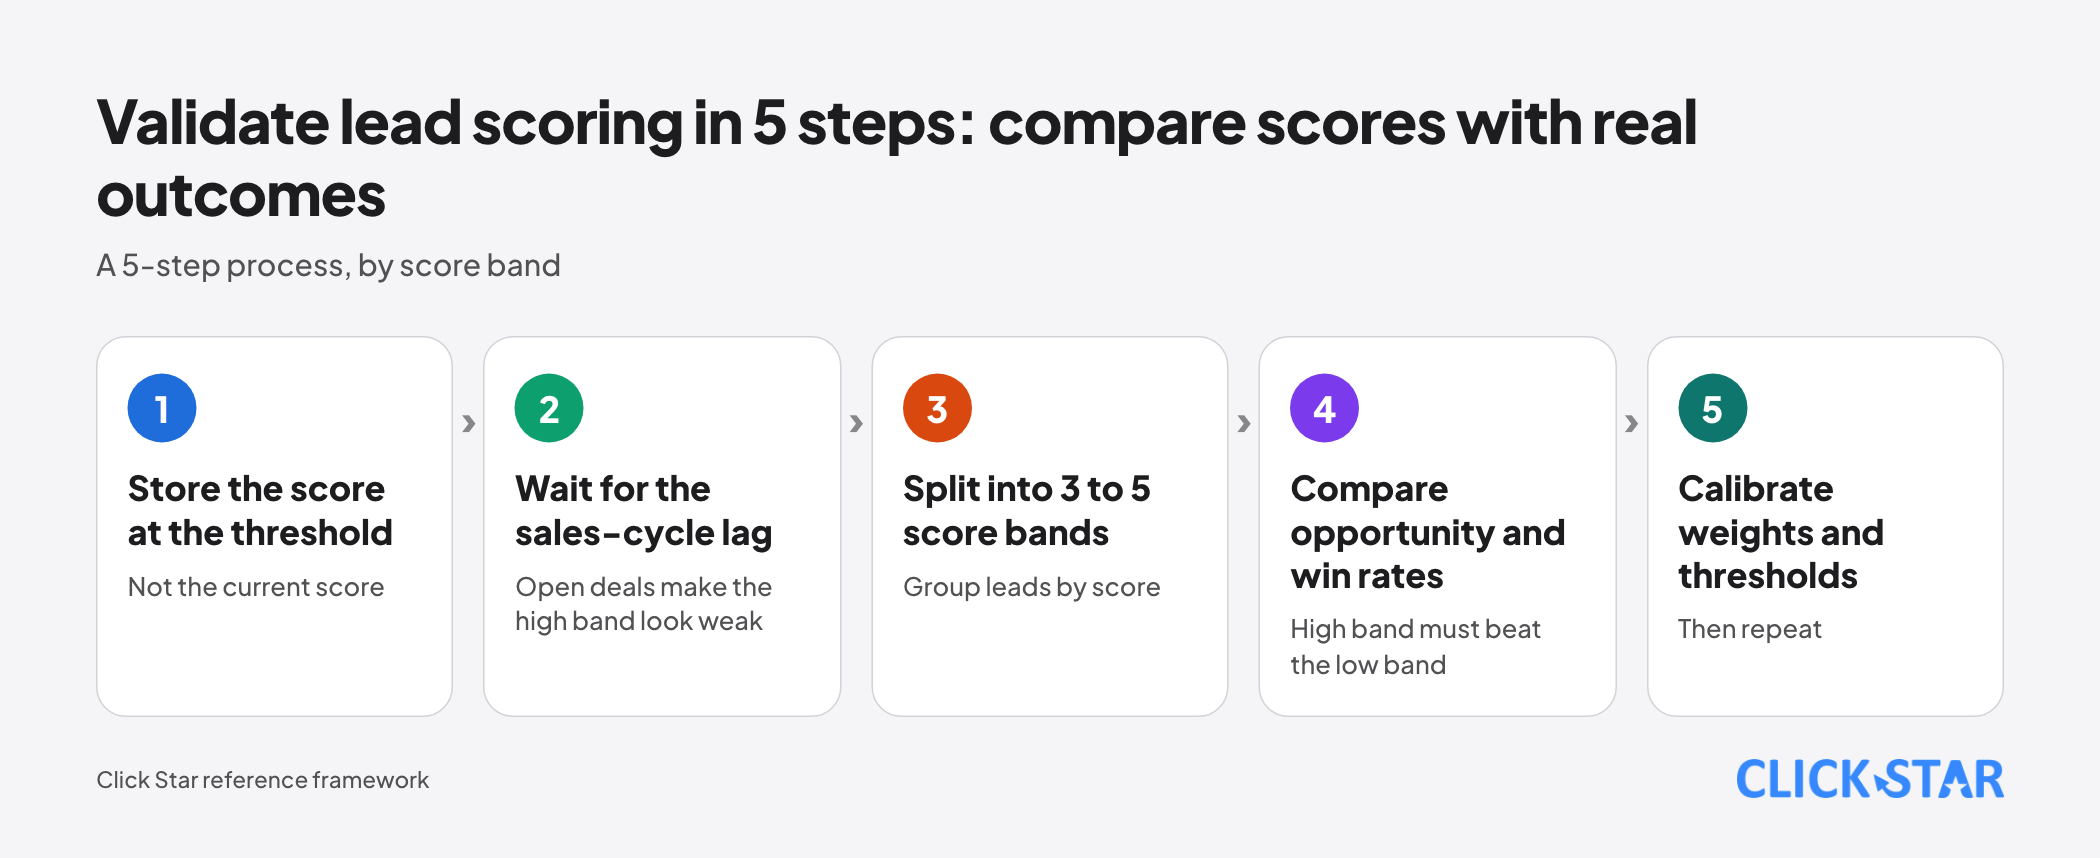
Step 1, store the score when the lead reaches the threshold, not the current score. Scikit-learn calls using information unavailable at prediction time data leakage, which makes test results look better than reality. In Click Star's view, a score computed after sales called is one example.
Step 2, wait for the sales-cycle lag. If deals take weeks to close, judging after 1 week makes the high band look weak because deals are still open.
Steps 3 and 4, split into 3 to 5 score bands, then compare the opportunity and win rates. The high band must beat the low band, stably across periods.
Step 5, calibrate weights and thresholds, then repeat.
For predictive models, Microsoft lists metrics such as accuracy, recall, F1 and AUC. AUC is the probability that the model ranks a random qualified lead above a random disqualified one.
A common bias: sales calls only high-score leads, so outcomes for low-score leads are missing. In the Click Star framework, keep calling a small share of below-threshold leads to learn whether the scale misses prospects.
How to measure results without inventing numbers
The core metric is the rate of threshold-reaching leads that become opportunities: those that became opportunities within N days, divided by all threshold-reaching leads in the same period. Take N from your own sales-cycle lag.
Supporting metrics:
- The same rate for the below-threshold group; the gap shows whether the scale works
- Time from reaching the threshold to the first sales contact
- The conversion rate before the scale existed, as a baseline
Bias and personal data
Scoring processes personal data to classify people. Microsoft warns that automatic scoring can introduce privacy problems and that organizations are responsible for compliance (Microsoft Learn, October 13, 2026).
NIST (US), in publication SP 1270 (March 15, 2022), states that bias is endemic across technology processes and can cause harm even when unintended. In Click Star's view, if sales previously served only one kind of customer, a model learns that habit.
Click Star reference principles, not legal advice: use only data with a suitable purpose and consent; do not score on sensitive attributes or their proxies; do not let a score automatically refuse a sale; store reasons and versions.
Check the original Vietnamese legal text before deploying; Click Star has separate articles on the 2027 personal data protection law and on cookie banners and consent under Vietnamese and international law.
Aligning sales and marketing on definitions
A scale works only when the 2 teams agree on MQL, SQL and response time.
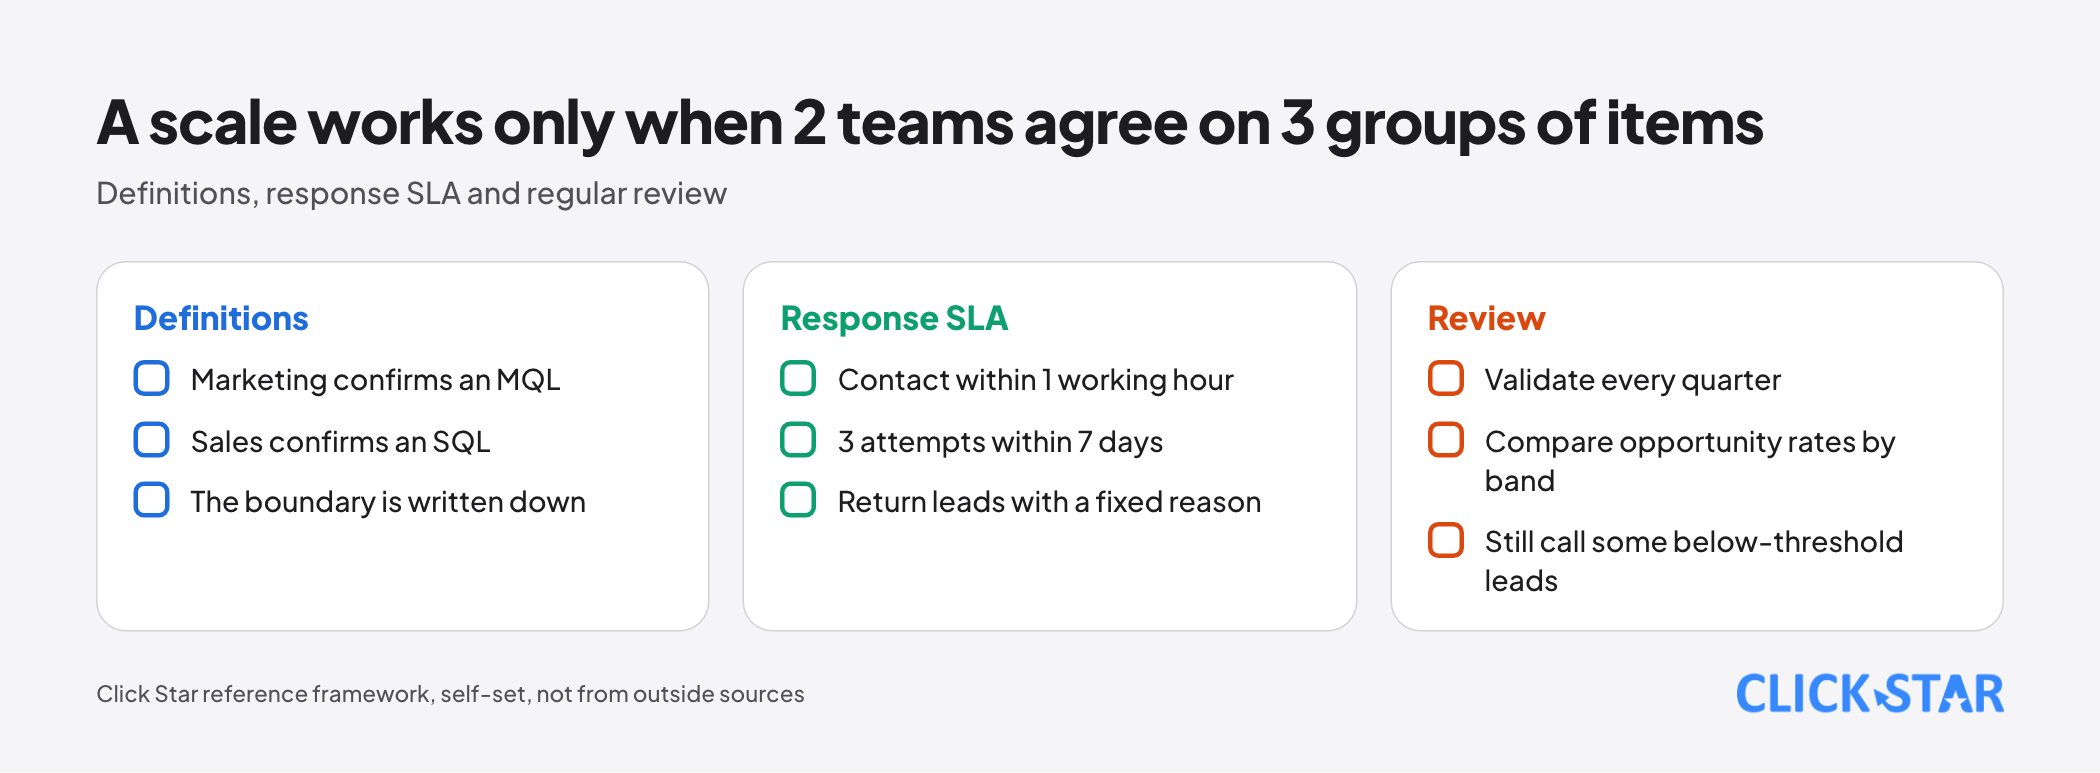
A Click Star reference SLA, self-set and adjustable to staffing: a lead reaching the threshold is contacted within 1 working hour; if 3 attempts within 7 days fail, it moves to nurturing; sales returns a lead with a reason from a fixed list.
Click Star's view. Click Star sells CRM and CDP services, so it has an interest here; this is a technical opinion only. A business with few closed leads should start with a small rule-based scale that is easy to explain, then validate every quarter.
Add machine learning only when leads with outcomes are plentiful and data is unified, because a customer split across records skews scores and outcomes.
30-day plan
- Days 1 to 7: meet sales and marketing, write the MQL and SQL definitions and return reasons; check that each lead is one record with source, status and outcome.
- Days 8 to 14: build a rule-based scale with fit, engagement, negative points and decay; label the initial threshold a hypothesis.
- Days 15 to 21: turn scoring on, store the score at threshold time, run the SLA.
- Days 22 to 30: split past leads by score band, compare opportunity rates, note gaps and schedule a review.
Common mistakes
- Adding up total points without separating fit from engagement.
- Setting the threshold by feeling and never comparing it with outcomes.
- Turning on machine learning without enough leads with outcomes or while data is still split across records.
What is not known
Click Star has no measurement of how many Vietnamese businesses use lead scoring or of conversion after adoption. No open source gives a standard threshold or SLA.
The Salesforce Einstein guide is the Spring '23 edition, so its figures may have changed. Click Star has not checked the provisions on automated profiling in Vietnam's personal data law.
Related posts
Need tailored advice for your business?
Click Star helps you build a solution that fits your industry and scale. We answer every question during business hours.