Which metrics belong on an executive dashboard: examples for sales, marketing and customer care
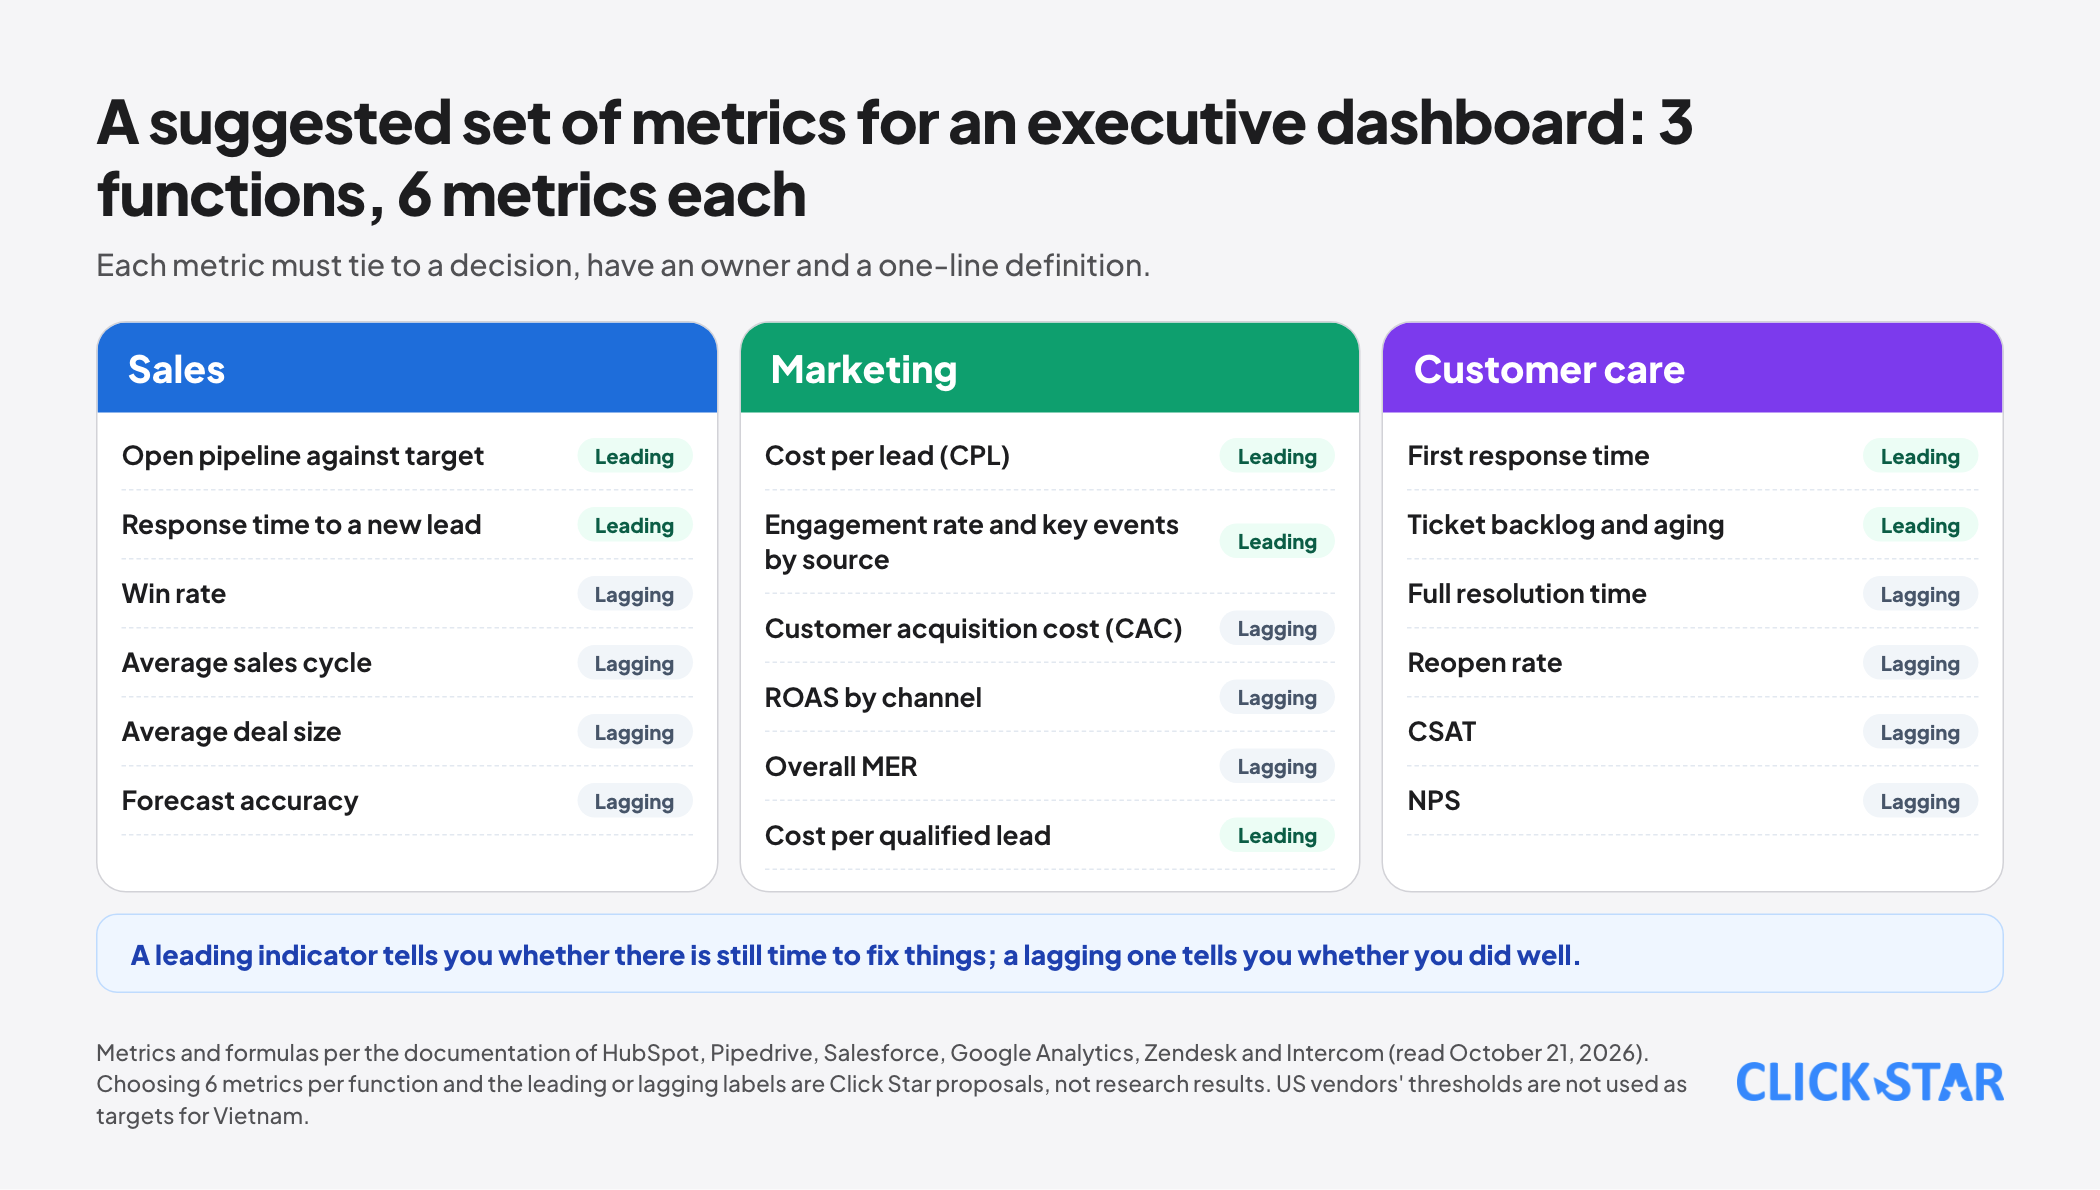
A suggested set of executive dashboard metrics for 3 functions, each with a definition, a formula and where it gets misread, based on documentation from HubSpot, Pipedrive, Salesforce, Google Analytics, Zendesk, Intercom and Nielsen Norman Group.
Many executive dashboards have 40 number tiles and nobody knows which tile to look at to decide what. When every metric is put on the screen, none stands out, and the weekly meeting turns into explaining why one number differs from another.
This article answers which metrics belong on an executive dashboard, for 3 functions: sales, marketing and customer care. Each metric comes with a definition, a formula and the places it is often misread. Sources include Nielsen Norman Group, guides and documentation from HubSpot, Pipedrive, Salesforce, Google Analytics, Zendesk, Intercom and dbt, read on October 21, 2026.
Click Star already has a general article on building a data dashboard for businesses. This one goes into choosing metrics and defining them. Vendors' reference thresholds (such as a 3x pipeline ratio or a 3:1 ROAS) are data or opinion from the US market, not thresholds for Vietnam, so the article does not use them as targets.
Key points
- An executive dashboard aims to convey critical information on one screen, glanceable with little interaction (according to Nielsen Norman Group). Detailed data exploration belongs in analytical reports.
- Click Star found no study giving an optimal number of metrics for one dashboard. Click Star's proposal: about 5 to 7 metrics per function, each tied to a specific decision.
- Each metric needs a one-line definition. Both call it "win rate," but HubSpot computes won divided by total opportunities, while Pipedrive computes won divided by (won plus lost). The 2 ways give 2 different numbers.
- For sales: the pipeline ratio against the target depends on win rate and sales cycle. The "3x" rule holds only when win rate is 33% and the cycle is one year (Salesforce).
- For marketing: ROAS is measured per channel, MER across all revenue and marketing spend. Numbers from Meta, Google and GA4 differ because attribution differs.
- For customer care: always pair a speed metric (first response, resolution time) with a quality metric (reopen rate, CSAT).
How an executive dashboard differs from an analytical report
According to Nielsen Norman Group's article (Page Laubheimer, June 18, 2017), a dashboard focuses on one task, conveying critical information, viewed quickly on one screen, with little interaction and no exploration. The article splits dashboards into operational (time-sensitive) and analytical types.
The same article advises using bars, lines and position for comparison instead of pie charts, donuts, gauges or treemaps, avoiding 3D, and not using color to encode magnitude. The definition of a dashboard as a display on one screen for monitoring at a glance is also attributed to Stephen Few by many sources; Click Star could not read the original text and quotes it only as those sources cite it.
On the number of metrics, Click Star found no study giving a figure. Any rule such as "5 to 9 metrics" is only opinion. Click Star proposes about 5 to 7 metrics per function because that is what people in a meeting can read and remember, but this is experience, not a research result.
Choosing metrics with 4 questions
A metric deserves a place on the dashboard only when it answers all 4 questions below. This is Click Star's filter.
- Which decision would change if this number rose or fell?
- Who is responsible for this number and has the authority to influence it?
- Can the definition be written in one line, including the denominator?
- When is the data updated and where does it come from?
In addition, include both leading indicators (which predict results, such as booked meetings) and lagging indicators (results that have happened, such as revenue). The idea of balancing financial measures with customer, internal process and learning measures comes from Kaplan and Norton's article in Harvard Business Review (1992). HubSpot calls quota attainment a lagging indicator.
A lagging indicator tells you whether you did well; a leading one tells you whether there is still time to fix things.
Metrics for sales
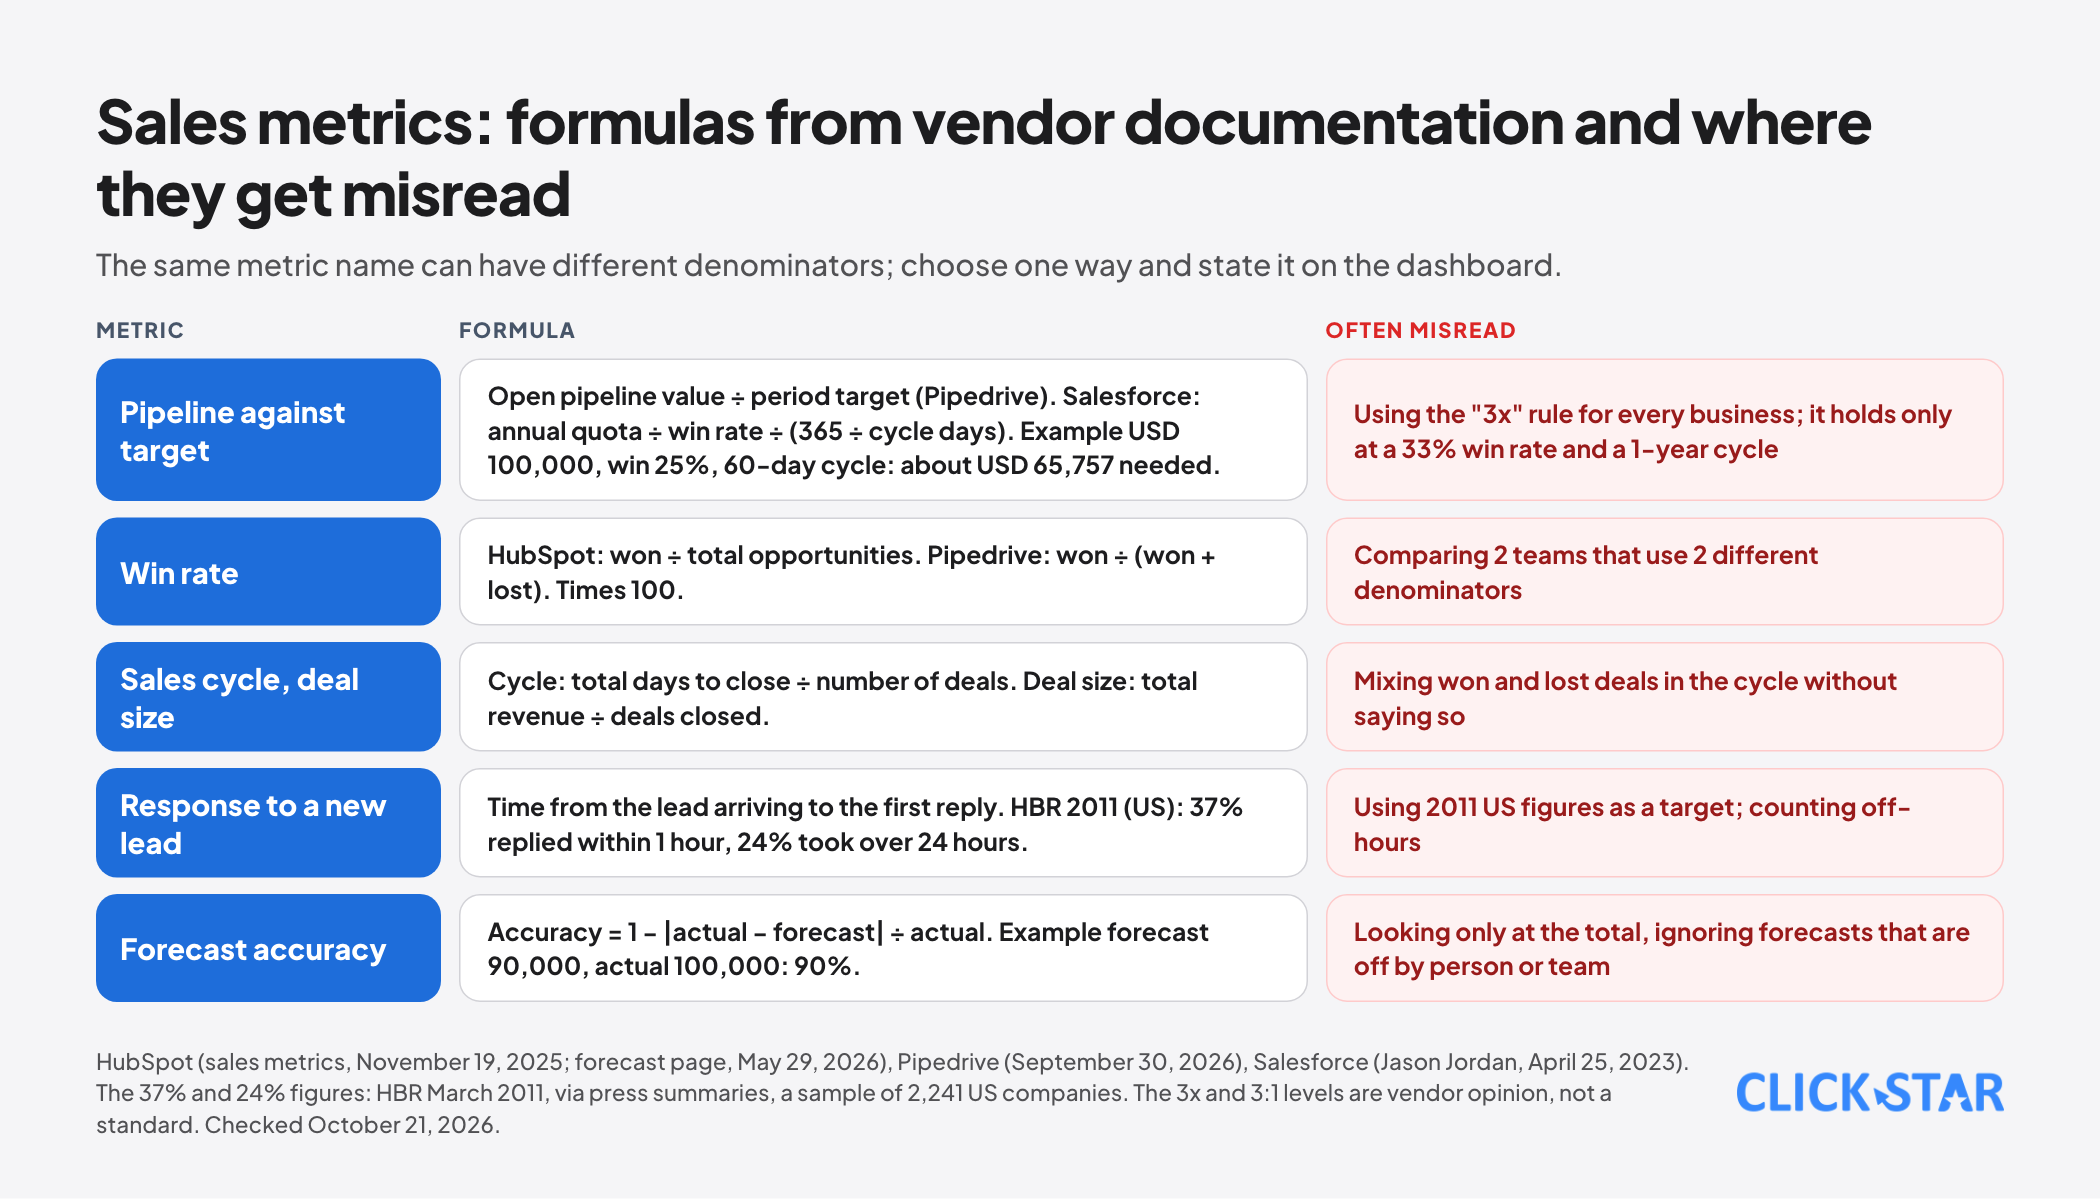
Pipeline coverage against the target. According to Pipedrive, it is the value of open pipeline divided by the revenue target for the period, and teams often aim for 3 to 4 times. HubSpot cites 3:1 to 5:1. Salesforce (Jason Jordan, April 25, 2023) argues that the 3x rule holds only when the win rate is exactly 33% and the sales cycle is one year.
Salesforce's formula: the pipeline needed equals the annual quota divided by the win rate, divided by (365 divided by the cycle length in days). With a quota of USD 100,000, a win rate of 25% and a 60-day cycle, about USD 65,757 of pipeline is needed. In other words, the level you need must be calculated from your own win rate and cycle.
Win rate. HubSpot: opportunities won divided by total opportunities, times 100. Pipedrive: won divided by (won plus lost), times 100. 2 denominators give 2 results, so choose one and state it on the dashboard.
Average sales cycle. HubSpot: total days to close divided by the number of deals. Pipedrive computes it over closed deals, both won and lost. Average deal size: total revenue divided by the number of deals closed.
Response time to a new lead. According to press summaries of the article by Oldroyd, McElheran and Elkington (HBR, March 2011), in an audit of 2,241 US companies, 37% replied within 1 hour and 24% took more than 24 hours. The figure is American, from 2011, and Click Star has not read the full article.
Forecast accuracy. According to HubSpot's help page (May 29, 2026): accuracy equals 1 minus the error, where the error equals the absolute value of (actual minus forecast) divided by actual. For example a forecast of 90,000 against an actual of 100,000 gives 90% accuracy.
Metrics for marketing
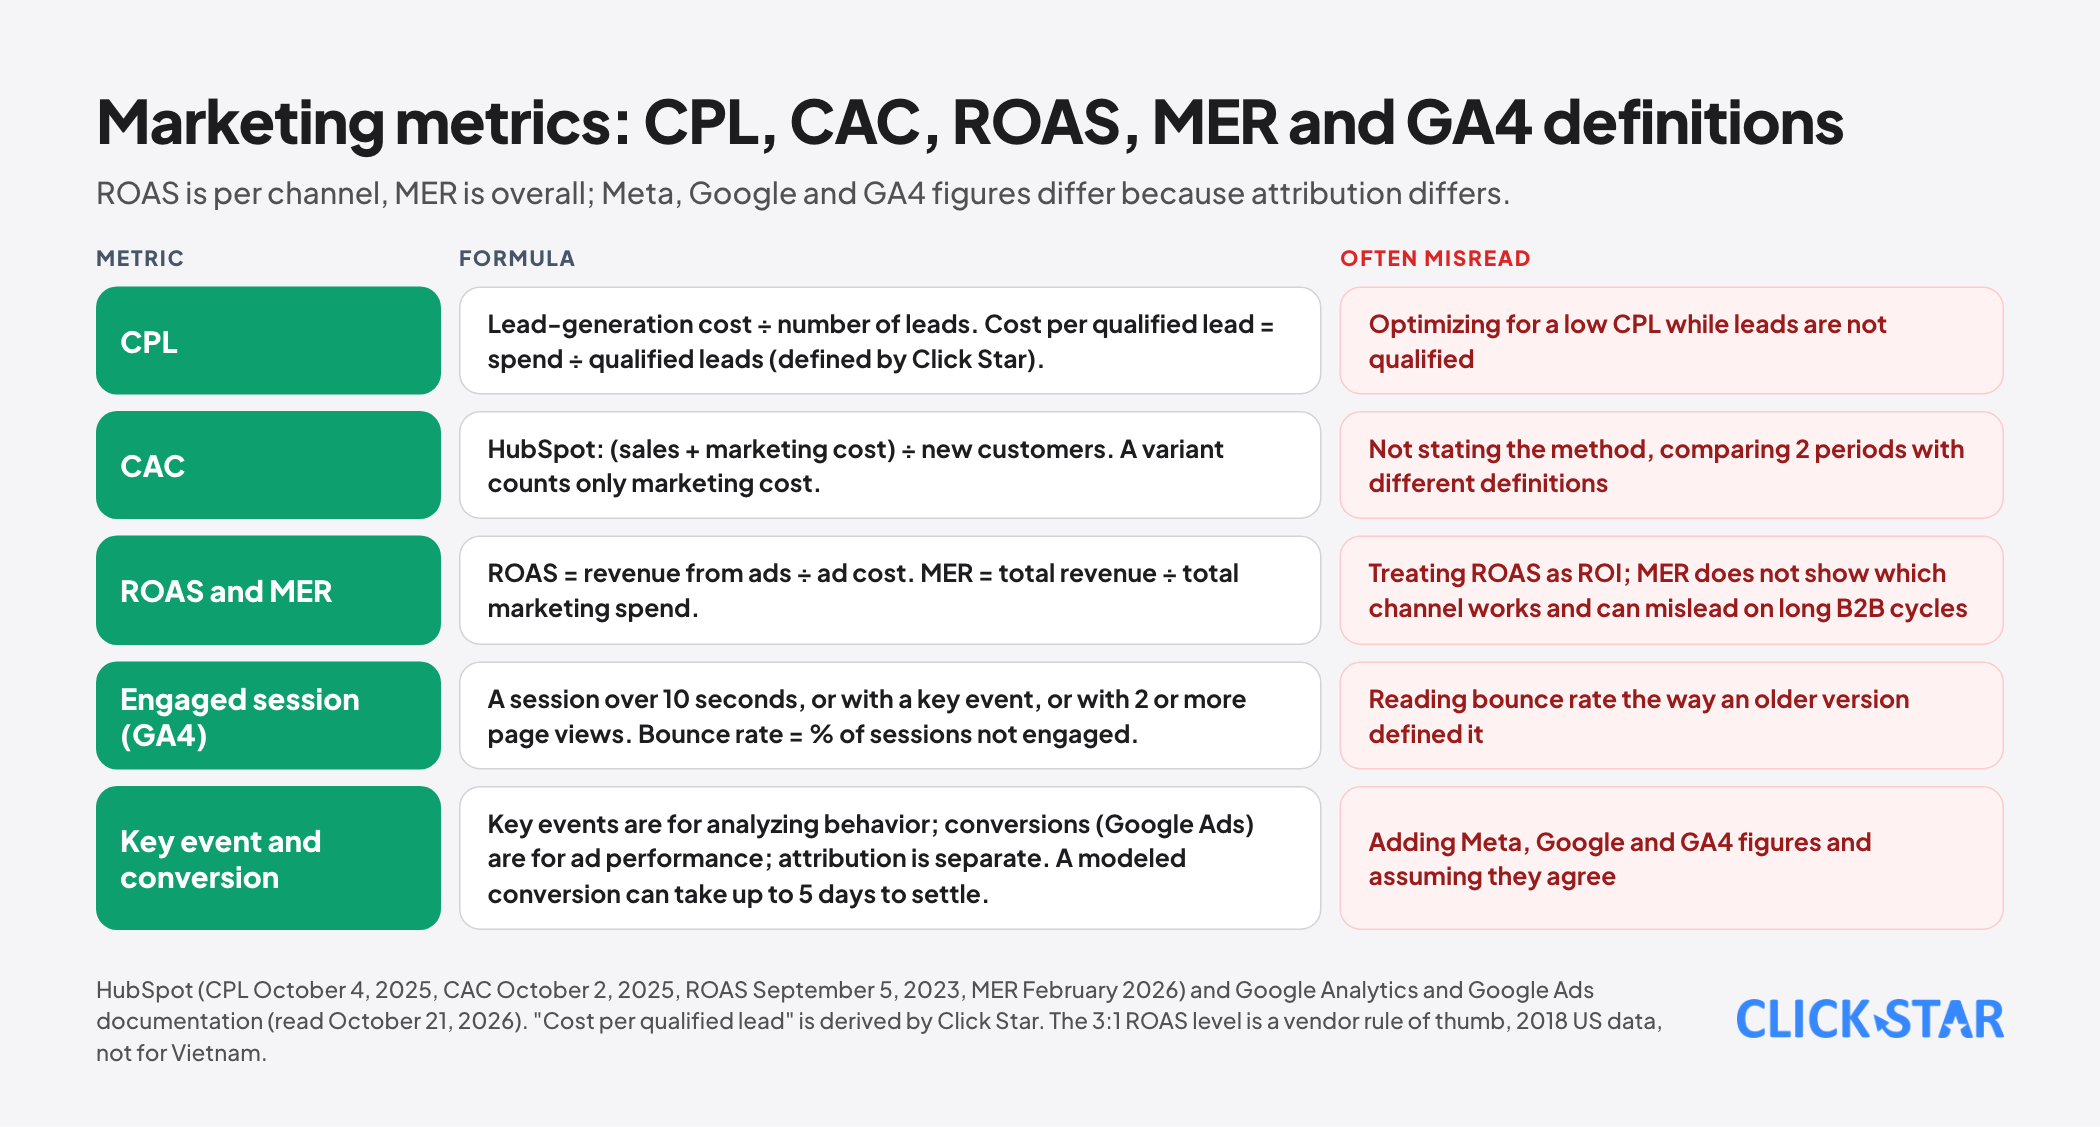
Cost per lead (CPL). According to HubSpot (October 4, 2025): lead-generation cost divided by the number of leads, with no universal benchmark. "Cost per qualified lead," spend divided by qualified leads, is a calculation Click Star derived, because it found no official definition.
Customer acquisition cost (CAC). HubSpot (October 2, 2025): total sales and marketing cost divided by new customers. A variant counting only marketing cost is also used, so state which.
ROAS and MER. According to HubSpot, ROAS equals revenue from ads divided by ad cost; it counts only ad cost and is not ROI. MER (marketing efficiency ratio) equals total revenue divided by total marketing spend across all channels. ROAS is for individual channels; MER gives the overall view but does not show which channel works. With long B2B cycles, MER based on closed revenue can mislead.
The "3:1 is good" level HubSpot gives for ROAS is a vendor rule of thumb based on 2018 US data and should not be used for Vietnam.
Metrics in GA4. According to Google's documentation, an engaged session is one that lasts longer than 10 seconds, or has a key event, or has 2 or more page views. Engagement rate is the percentage of engaged sessions, and bounce rate is the percentage of sessions that are not engaged.
A key event and a Google Ads conversion are 2 different things, with separate attribution settings. A modeled conversion is an estimate of conversions Google cannot observe directly, included only when it is confident enough, and it can take up to 5 days to settle. That is why GA4, Google Ads and Meta figures never match exactly.
Metrics for customer care
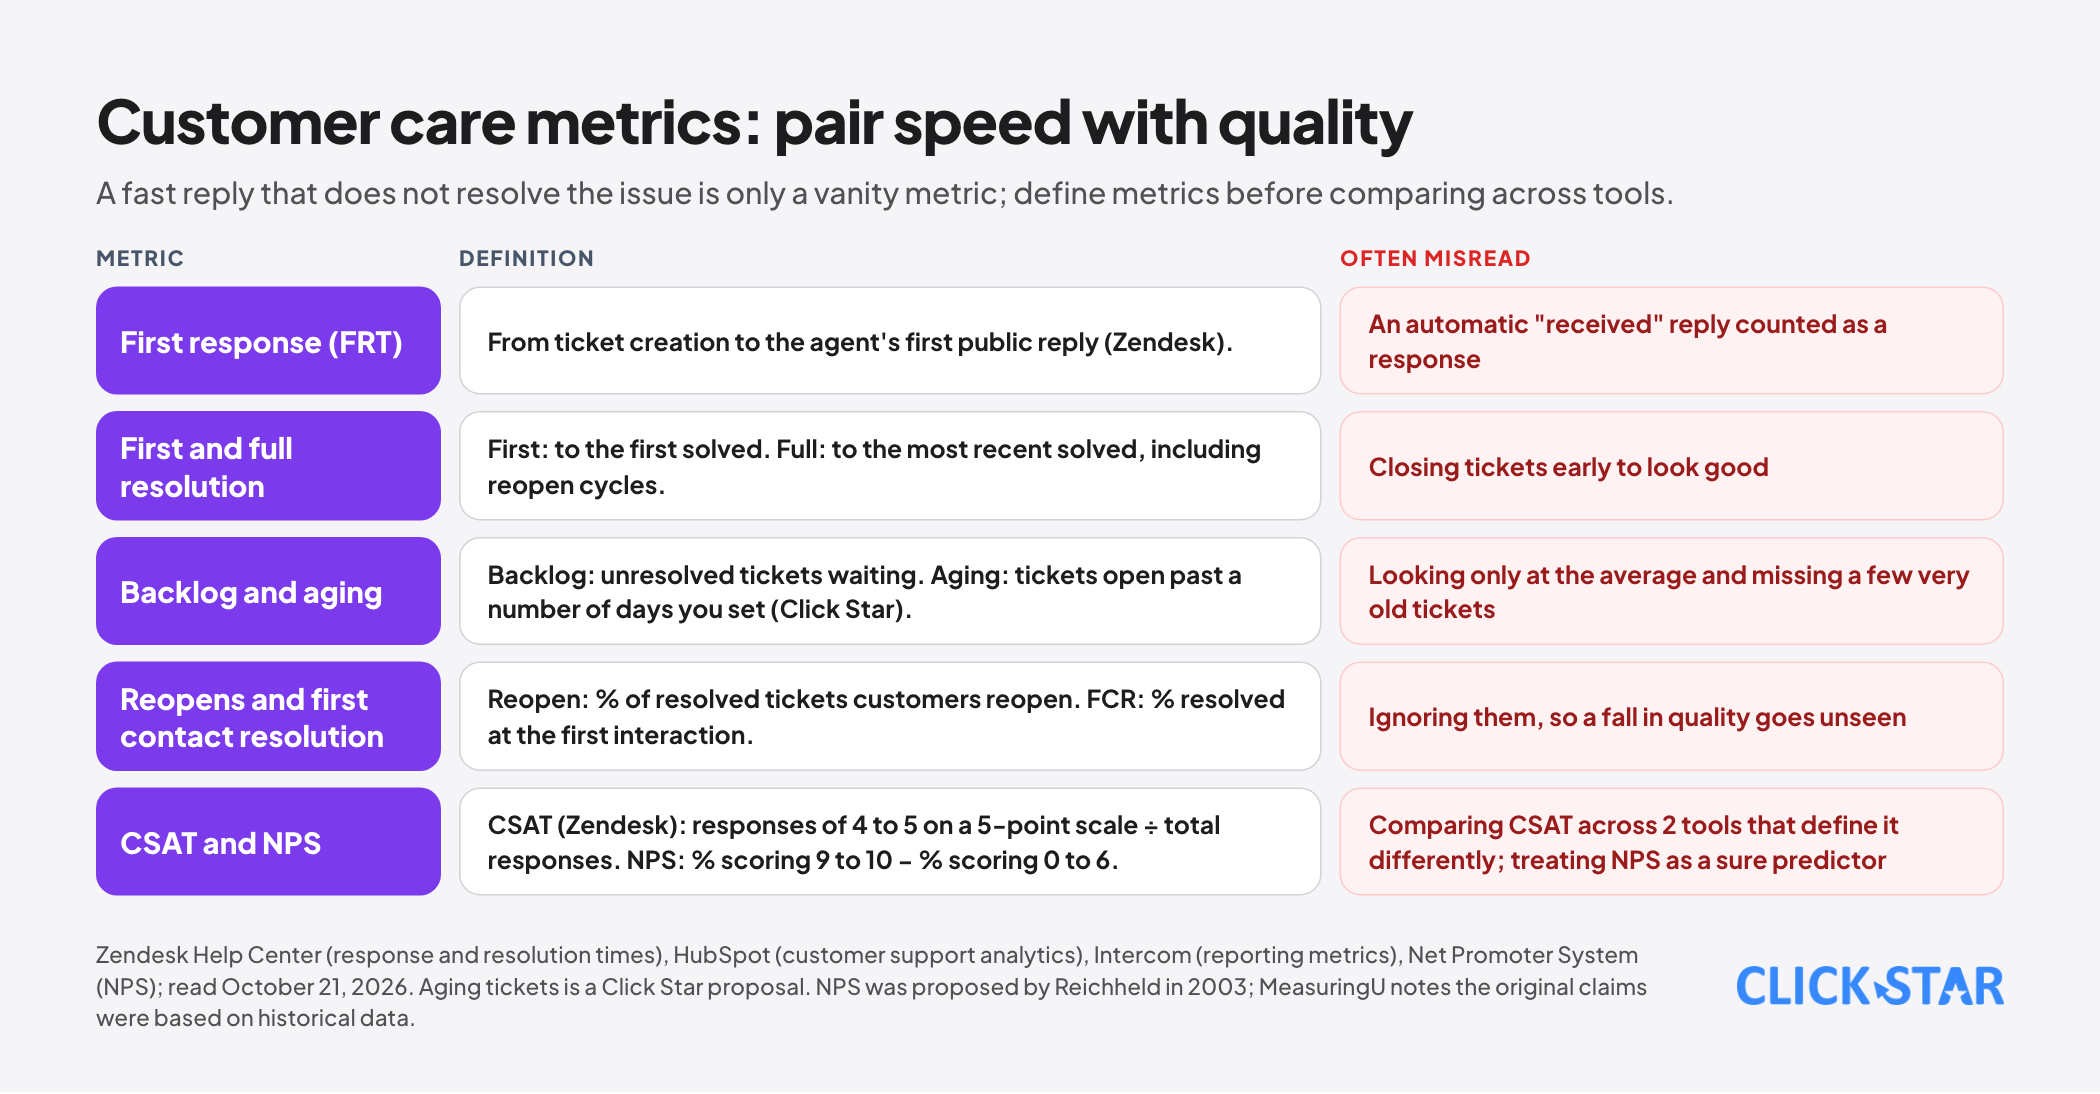
Speed. Zendesk defines first reply time as the time from ticket creation to the agent's first public reply. First resolution time is to the first time the ticket is marked solved, while full resolution time is to the most recent time and includes reopen cycles. Backlog is the number of unresolved tickets waiting (HubSpot).
Quality. Reopen rate is the percentage of resolved tickets that customers reopen. First contact resolution (FCR) is the percentage of tickets resolved at the first interaction. HubSpot advises pairing speed metrics with quality metrics, because a fast response that does not resolve the issue is only a vanity metric.
Satisfaction. CSAT per Zendesk is satisfied responses (4 to 5 on a 5-point scale) divided by total responses; Intercom calculates it as the share of positive ratings out of all ratings. Tools define it differently, so agree on it before comparing.
NPS per the Net Promoter System page: ask how likely customers are to recommend the business to a friend or colleague on a 0 to 10 scale, promoters are 9 to 10, detractors are 0 to 6, and NPS equals the percentage of promoters minus the percentage of detractors. Fred Reichheld proposed the metric in 2003. MeasuringU notes that the original claims were based on historical, not predictive, data.
Aging tickets. Click Star found no vendor definition. The proposal: count tickets open longer than a number of days that the business sets by request type.
Metric governance: so the numbers on the dashboard are not disputed
dbt's documentation (MetricFlow) describes defining a metric once, in a version-controlled file, so the data team and the business team treat it as the single source. If everyone queries separately, the results tend to be confusing and inconsistent. That is a tool vendor's documentation, not research.
Click Star proposes a simple version for small businesses: one metric definition page (name, formula, denominator, source, owner, update frequency), and each tile on the dashboard carrying an "updated at" line and the name of its owner. This is a recommended practice with no research source.
Click Star's view. A good executive dashboard is one that can end the argument about the numbers and start the argument about the action. Whenever someone asks "how is this number calculated," the answer should be on the definition page.
A 14-day plan
- Days 1 to 3: each function chooses 5 to 7 metrics with the 4 questions above, including leading and lagging indicators.
- Days 4 to 7: write the definition page (formula, denominator, source, owner), and agree on the denominators of win rate and CSAT.
- Days 8 to 11: build a first version on one screen, using bars and lines instead of pie charts, with the target and the trend beside the current number.
- Days 12 to 14: use it in one weekly meeting, note which tiles nobody looks at, remove them, and set a monthly review.
What is not known
Click Star has no standard Vietnamese data for any metric in this article. The reference levels from HubSpot, Pipedrive and Salesforce are vendor figures from the US market. The lead-response figures come from press summaries, and the original article was not read in full.
Click Star could not read Stephen Few's original text or Meta's help pages on attribution settings. Some HubSpot pages use ambiguous date formats. No study determines the optimal number of metrics for a dashboard.
Common mistakes
- Putting too many metrics on one screen, so none stands out.
- Using the same metric name with different denominators across functions.
- Looking only at lagging indicators such as revenue, when it is too late to fix things.
- Using US-market thresholds (ROAS 3:1, pipeline 3x) as targets for your own business.
- Measuring care speed without quality, so agents close tickets fast to look good.
- Adding Meta, Google and GA4 figures together and assuming they agree.
- Using pie charts, gauges or 3D, making values hard to compare.
Related posts
Need tailored advice for your business?
Click Star helps you build a solution that fits your industry and scale. We answer every question during business hours.