One-time buyers who never return? Read repeat rates by cohort
The overall average can hide new customers returning less than older ones. This article explains cohort analysis in GA4 and from CRM orders, based on Google Analytics Help and Mixpanel documentation.
A skincare shop owner sees about 10% of customers buying again and relaxes. But split customers by the month of their first purchase and new ones may return at only 50% of the older customers' rate, a gap the average hides (hypothetical scenario).
This article covers cohort analysis (a cohort is a group of people who start at the same point in time): how to build it in GA4 (Google Analytics 4, Google's website measurement tool) and from CRM orders, how to read the return curve, and which traps are common.
The main sources are Google Analytics Help pages and Mixpanel's documentation, checked on October 26, 2026. Click Star already has separate articles on RFM segmentation, CAC, ROAS and LTV, and GA4 events, so this one does not repeat them. All example numbers are made up.
Key points
- A cohort groups customers by a starting point, such as the month of first purchase, then follows each group. This shows whether newer groups do better than older ones, which the overall average cannot.
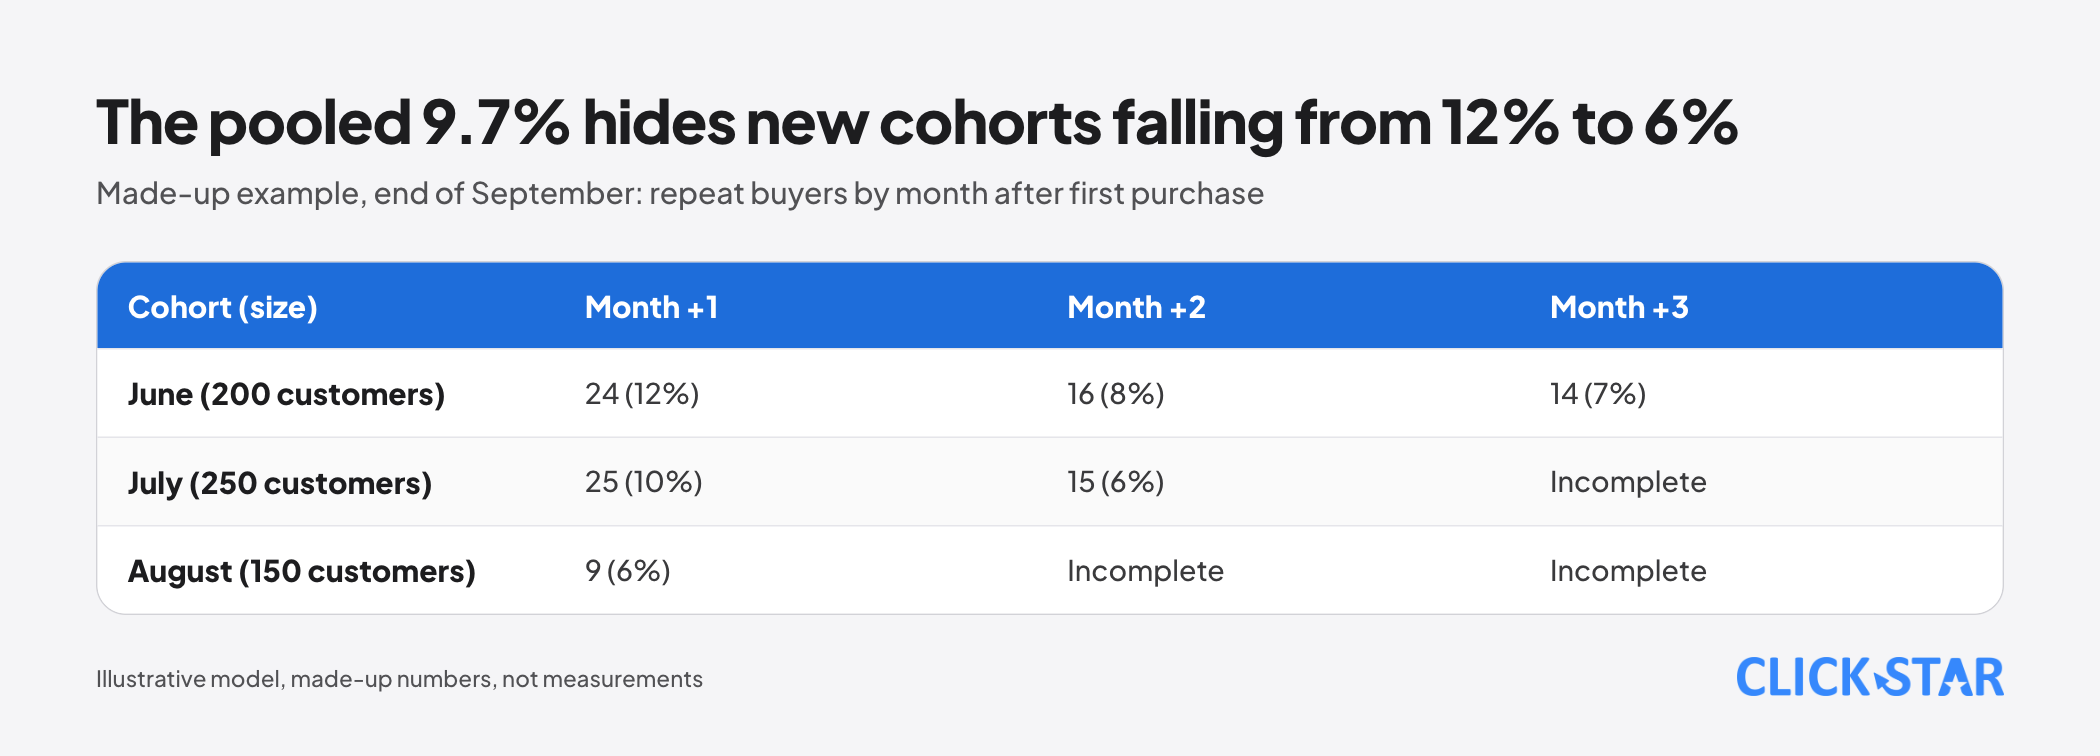
- In the made-up example, 3 cohorts return at 12%, 10% and 6% in the first month, yet the pooled average is 9.7%.
- GA4's Cohort exploration has 3 calculation types and a maximum of 60 cohorts. Per its documentation, it uses device data only and ignores User-ID.
- GA4 Explorations data is kept for only 2 months by default. To look further back, a standard property must be set to 14 months.
- With customer IDs in a CRM, a table built from orders is usually closer to reality than GA4 because it counts people, not browsers (Click Star's view).
- Tables go wrong through tiny cohorts, incomplete cells, promotion months and changed counting rules. The article gives no "good" rate by industry because no source exists.
What is a cohort, and why does the overall average mislead
A cohort is a group of people who start at the same point, for example everyone who first bought in June. You follow that group alone to see how many return. Per the Google Analytics Help page on Cohort exploration, a cohort shares a characteristic, such as the same acquisition date.
An example with entirely made-up numbers, as of the end of September. "Month +1" is the month right after the first purchase month, and "month +2" the one after.
- June cohort: 200 customers. 24 bought again (12%) in month +1, 16 (8%) in month +2, and 14 (7%) in month +3.
- July cohort: 250 customers. 25 bought again (10%) in month +1 and 15 (6%) in month +2. Month +3 is October, so it is incomplete.
- August cohort: 150 customers. 9 bought again (6%) in month +1. Later months are incomplete.
Pooling the 3 cohorts at month +1 gives 58 buyers out of 600 customers, or 9.7%. That sounds fine, but it hides a rate falling from 12% to 6%.
Each cohort is compared at the same "age" (the same month +1 column), which is fair. The pooled average mixes old and new customers, so the larger cohort hides the one getting worse.
How many ways can "returned" be counted
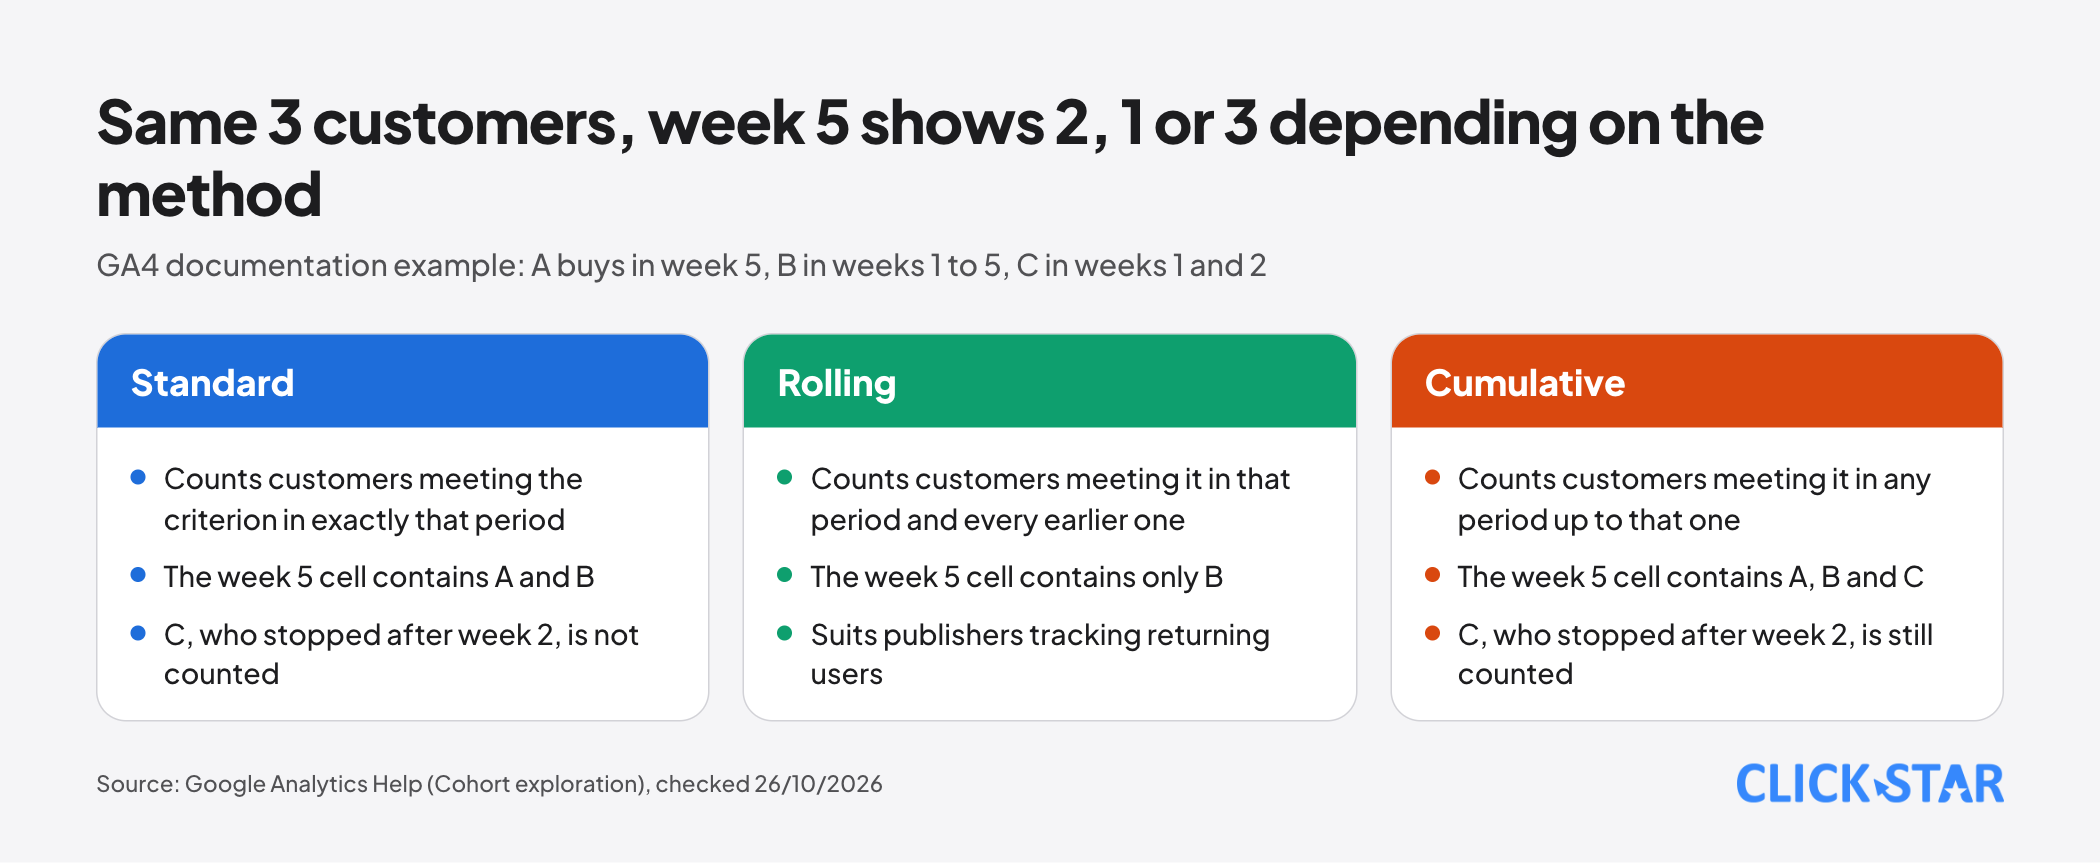
The same data can give different rates because "returned" can be defined in several ways. GA4 offers 3 calculation types, per the Cohort exploration page. In its example, customer A buys only in week 5, B buys in weeks 1 to 5, and C buys in weeks 1 and 2 then stops.
- Standard: each cell counts customers who meet the return criterion in exactly that period. The week 5 cell contains A and B.
- Rolling: each cell counts customers who meet it in that period and every earlier one. The week 5 cell contains only B. The documentation says this suits publishers tracking returning users.
- Cumulative: each cell counts customers who meet it in any period up to that one. The week 5 cell contains A, B and C.
Other tools name things differently. Per Mixpanel's documentation, "On" counts customers who return in exactly that time unit, while "On or After" counts those in that unit or any later one, whereas GA4's Cumulative runs up to the current period. Write the definition of "returned" on the table.
Building it with Cohort exploration in GA4
Cohort exploration sits under Explore in GA4. Per the help page, open Template Gallery, choose the Cohort exploration template, then set an inclusion criterion (who joins the cohort) and a return criterion.
The inclusion criterion has 5 options: First touch (the first time GA4 sees the customer), Any event, Any transaction, Any conversion, or 1 specific event. The return criterion has the 4 similar options, minus First touch.
Next, choose daily, weekly or monthly granularity. Days run midnight to midnight in the property's time zone, weeks run Sunday to Saturday. A breakdown shows at most the top 15 values, and each customer sits under the first value that applies.
For "do new website visitors buy", Click Star suggests First touch, weekly, with a purchase event as the return criterion, matching the documentation's own example.
"Do customers who bought once buy again" is better answered from orders. The documentation describes Any transaction as the first transaction in the exploration date range, yet also says a customer who transacts every week appears in every row. These are hard to reconcile and Click Star has not tested them on real data, so try a small cohort.
GA4 also has a ready-made Retention overview report (Life cycle > Retention), showing return rate by acquisition-day cohort at days 1, 7 and 30.
GA4 limits to know before trusting the table
- Device only: cohorts use device data and ignore User-ID (Cohort exploration page). On websites the device ID comes from the client ID (Reporting identity page), so 1 person on a phone and a laptop can count as 2 customers.
- Cookie expiry: the
_gacookie lasts 2 years by default, but the Cookie usage page says browsers cap first-party cookie lifetime if the visitor does not return: 400 days in Chrome, 7 days in Safari. Click Star infers that a Safari visitor returning after 7+ days may count as new. - Retention period: the Explorations page says data is kept 2 months by default. The Data retention page lets a standard property choose 2 or 14 months, for data not yet deleted. Click Star infers that with the default, older cohorts may be gone.
- Thresholds and sampling: demographic dimensions face data thresholds and tiny cohorts are dropped (Cohort exploration page). Queries over 10 million events may be sampled (Explorations page).
Building it from orders in a CRM or spreadsheet
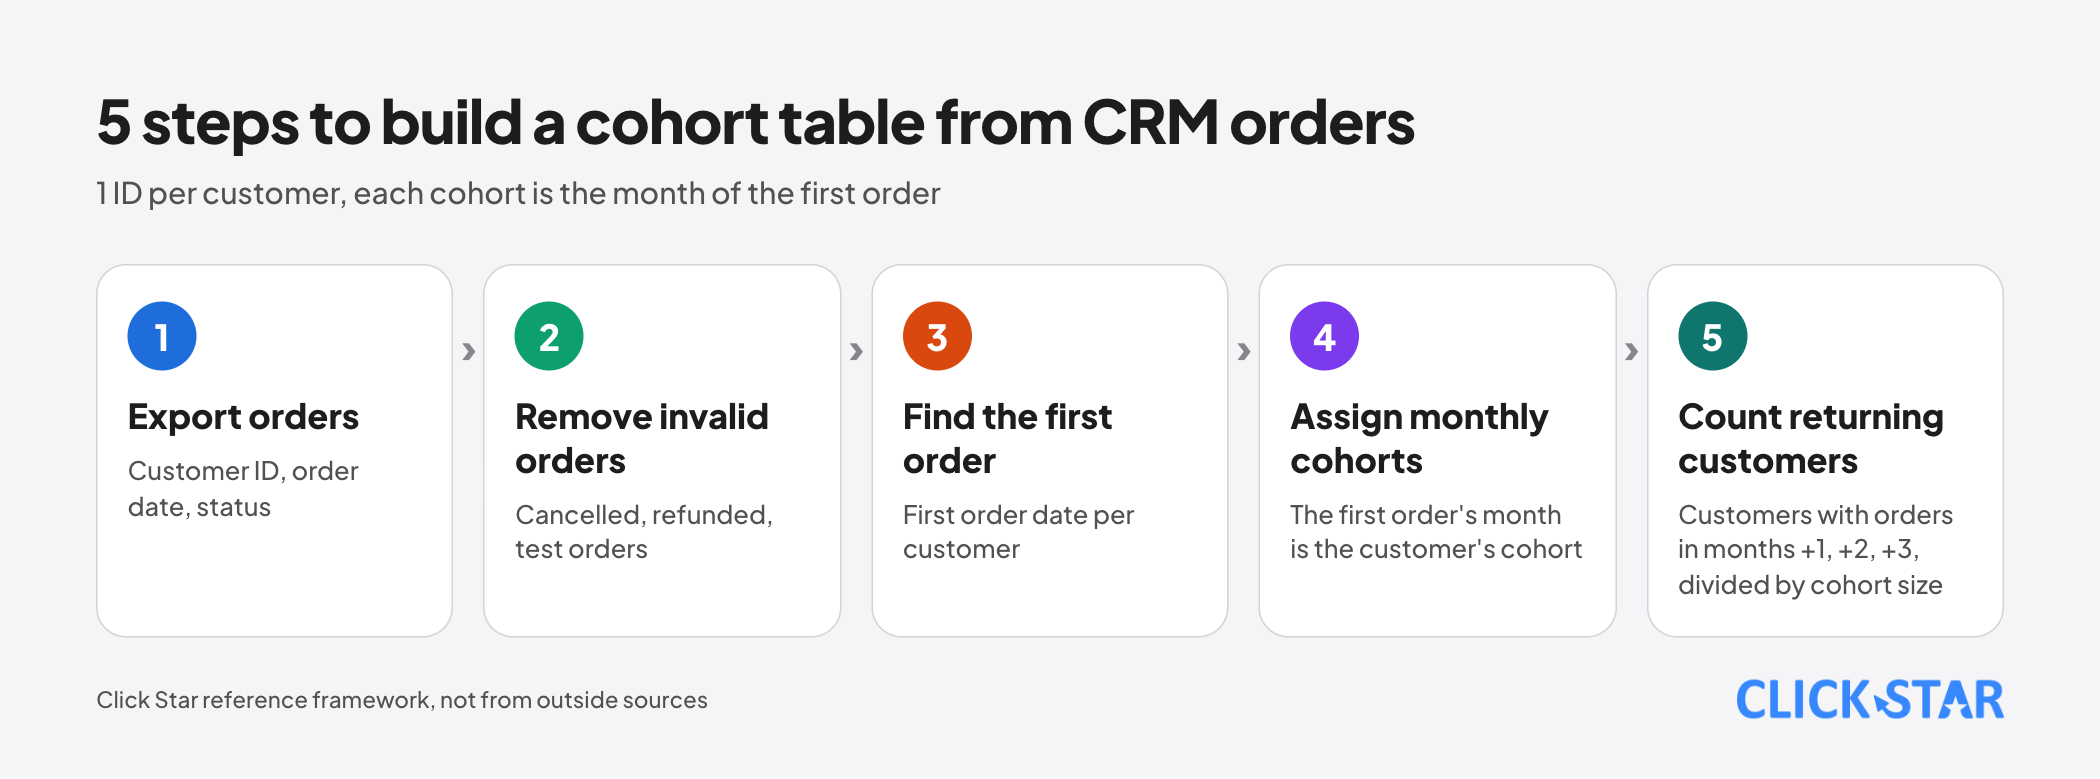
With customer IDs in a CRM or sales system, a cohort table built from orders is usually closer to reality. It counts people, and includes phone or in-store orders if they are in the system (Click Star's view).
The process has 5 steps:
- Export orders with customer ID, order date and status.
- Remove cancelled, refunded and test orders.
- Find each customer's first order date.
- Assign each customer to the cohort of that first order's month.
- Count customers with orders in months +1, +2 and +3, then divide by cohort size.
Small data fits a spreadsheet. For large data, a technical team can use SQL: take the first order's month as the cohort, then count distinct customers per order month. The row matching the cohort month is the cohort size; divide later rows by it.
One condition: 1 customer must have 1 ID. Click Star already has a separate article on duplicate customer data. If 1 person becomes 2 IDs, the return rate looks falsely low.
Reading the table: 4 curve shapes and what to do
This is Click Star's reference framework, not from outside sources. The shapes help choose an action; they are not an industry standard.
- Sharp drop, then flat: most customers leave in the first period and the rest stay steady. Improve the first 30 days after purchase and look for what the staying group has in common.
- Steady decline with no floor: customers leave gradually. Check whether the product has a natural repurchase cycle, then test a repurchase offer or a membership program.
- A secondary peak: the rate rises again in a certain month, for example when the product runs out. Prompt a repurchase at that moment, after checking the peak is not caused by a campaign.
- Newer cohort lower than an older one in the same column, as in the opening example. Find what changed between the 2 (ad channel, offer, audience), then break the table down by each factor.
Traps that make a cohort table wrong
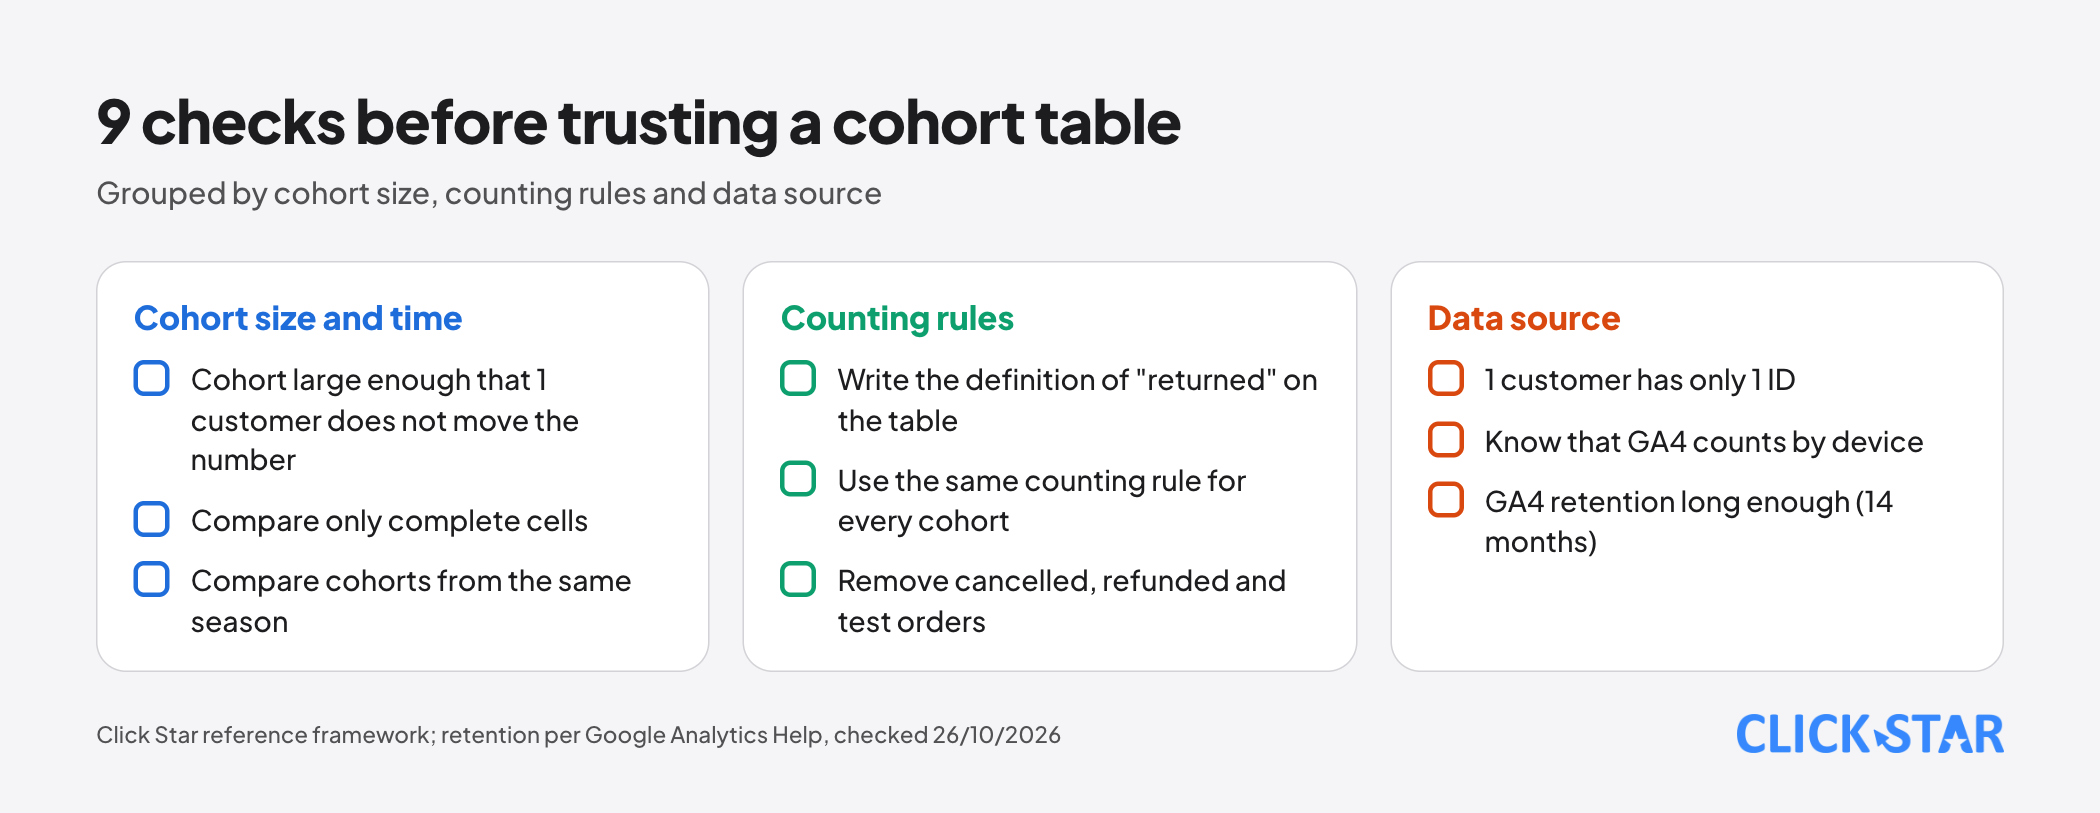
Tiny cohorts are the first trap. In the 150-customer cohort of the example, each customer shifts the rate by about 0.7 percentage points; in a 20-customer cohort, 5 points. Pool small cohorts by quarter or hold off concluding.
Incomplete cells are the second trap. Mixpanel marks unfinished cells with an asterisk because the period is still running. The August cohort has no month +2 yet, so never compare an incomplete cell with a complete one.
Seasons and promotions skew cohorts. Click Star infers that a big promotion month brings customers who came for the discount and return less. Compare with the same period last year or split by promotion code.
Changing the definition midway also breaks the table: switching from "bought exactly in month +1" to "bought from month +1 onward" raises the rate with no change in customers. The remaining traps, duplicate customers, device-based identification and the GA4 retention limit, are covered above.
The Vietnam context
Click Star found no measured return rate for Vietnamese businesses by industry, so no threshold is given. Use your own older cohorts as the benchmark, and pick weekly, monthly or quarterly periods that match the real buying rhythm.
If a phone number is the customer ID, normalize the format (0912 and +84 912 are the same number) before merging. Per the User-ID page, an ID sent to GA4 must not contain information a third party could use to identify someone. Click Star infers that raw phone numbers or emails should not be sent. Personal data is a legal topic: ask an expert.
Click Star's view. GA4 suits questions about which channel brings customers and how they behave on the site. "Do buyers come back" should rely on orders tied to customer IDs. 1 table, 1 definition and 1 owner matter more than the tool.
Click Star sells CRM, CDP and data dashboard services, so it has an interest here. With small data, a spreadsheet is enough.
14-day plan (Click Star reference framework)
- Days 1 to 2: fix the definitions. "Customer" is a CRM customer ID, and "returned" means at least 1 valid order in month +N.
- Days 3 to 5: export orders, remove cancelled orders and duplicates, and build the cohort table by first-order month.
- Days 6 to 8: build a Cohort exploration in GA4, check the data retention period, and change it to 14 months if needed.
- Days 9 to 11: read the table, identify the curve shape, and write a hypothesis for the weakest cohort.
- Days 12 to 14: choose 1 action to test on new customers. Once the cohort has aged, compare it with the earlier cohort at the same age, not the pooled average, and view several cohorts before concluding.
Common mistakes
- Looking only at the average return rate, without splitting by cohort.
- Comparing incomplete cells with complete ones.
- Concluding from cohorts of a few dozen customers.
- Not writing down the definition of "returned" and changing the counting rule between views.
- Trusting GA4 numbers while forgetting it counts by device and the data may have expired.
- Using raw phone numbers as customer IDs and sending them straight into GA4.
What is not known
Click Star has no measured return rate for Vietnamese businesses by industry, no source for a "good" retention threshold, and no sourced minimum cohort size.
It is unclear whether Cohort exploration uses modeled data when visitors decline cookies (the Reporting identity page mentions modeling in Blended mode, not Explorations). Click Star has a separate article on Consent Mode v2. It is also unclear how the Any transaction cohort is computed, since the documentation has 2 statements that are hard to reconcile.
The Google Analytics Help pages read show no update date.
Related posts

Need tailored advice for your business?
Click Star helps you build a solution that fits your industry and scale. We answer every question during business hours.