Paying more than rivals? What Quality Score can and can't say
Google Ads Quality Score is a diagnostic tool, not an input to the auction. Based on Google Ads Help pages, this article explains the 3 components and what to fix for each.
An English-language school runs Google ads for the keyword "English speaking course" and suspects a rival at the top of the results pays less per click (hypothetical case). The school's owner opens the report, sees a Quality Score of 4/10 and wonders what to fix.
This article covers Quality Score in Google Ads, the 1 to 10 score at keyword level, and Ad Rank, the value that decides which ad shows where. The main sources are Google Ads Help pages, checked on November 2, 2026.
It answers 3 questions: what the score measures, how it relates to cost per click, and what to fix.
Key points
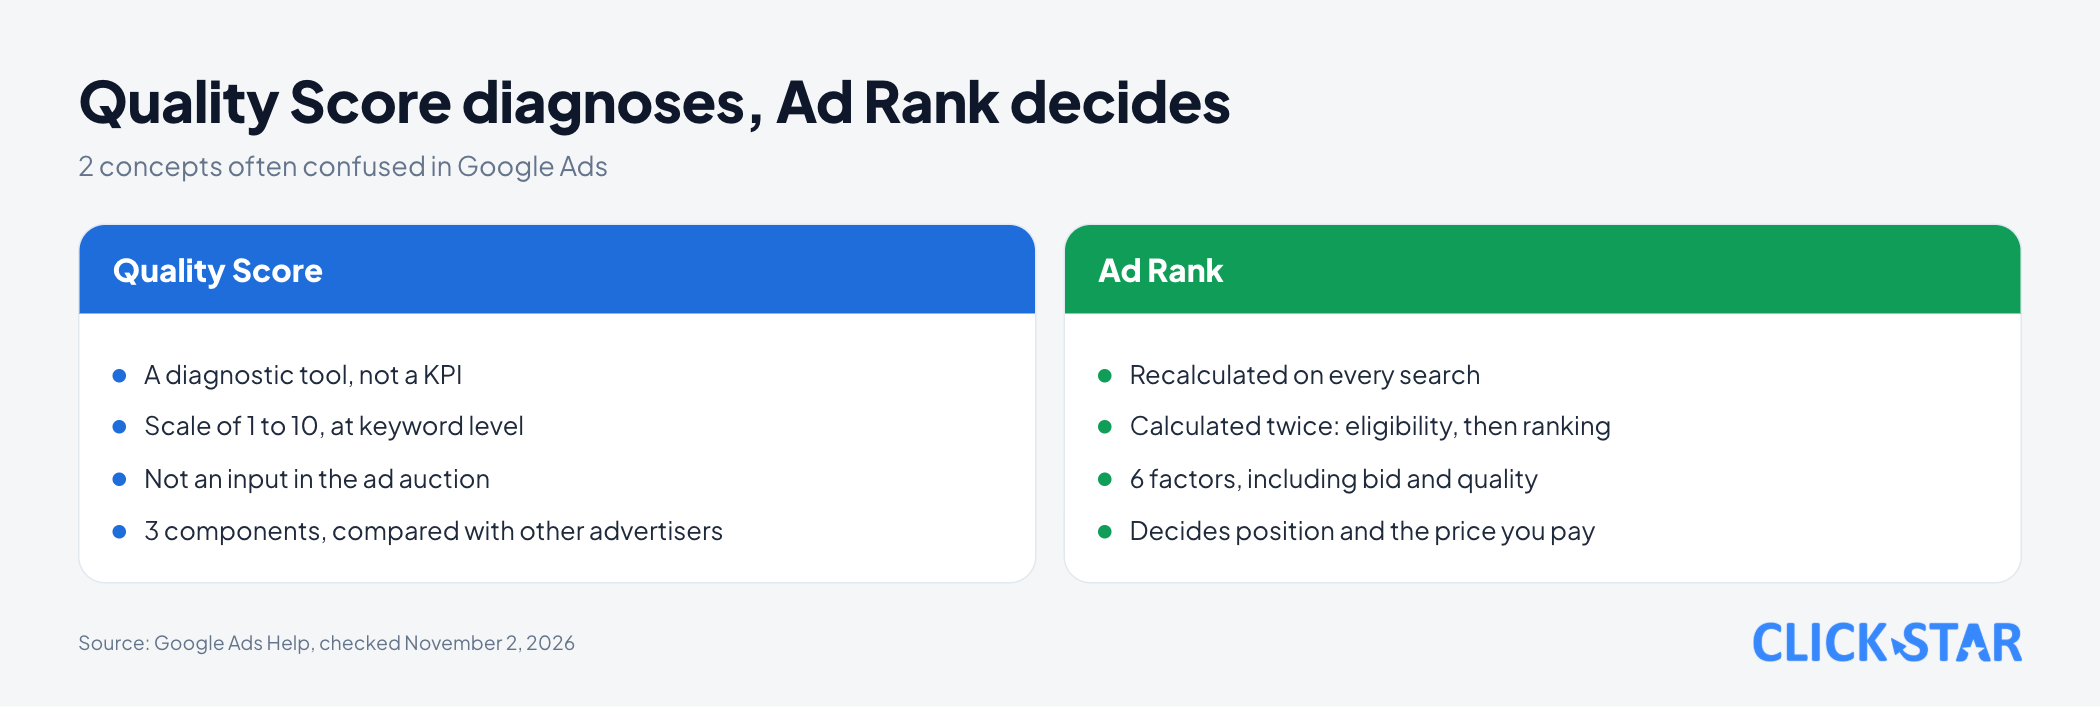
- According to Google Ads Help, Quality Score is a diagnostic tool on a 1 to 10 scale at keyword level. Google states it is not a key performance indicator (KPI) to optimize.
- The same page says Quality Score is not an input in the ad auction. Ad Rank uses quality measured at auction time.
- Ad Rank has 6 factors: bid, ad and landing page quality, minimum thresholds, auction competitiveness, search context and the expected impact of extra ad information.
- Quality Score has 3 components: expected clickthrough rate, ad relevance and landing page experience. Each is rated Above average, Average or Below average.
- Google says higher-quality ads typically cost less per click, but gives no size for the reduction.
- Quality Score alone cannot explain a price gap, and auction insights show no rival's cost per click, so you cannot conclude you pay more than rivals.
- What to do: find the weak component on your most expensive keywords, fix that part, then measure with real clickthrough rate, conversion rate and cost.
What Quality Score is, and what it is not
Quality Score is a diagnostic tool showing how your ad quality compares with other advertisers. According to the Google Ads Help page About Quality Score for Search campaigns (read November 2, 2026, no update date shown), the scale is 1 to 10 and it exists only at keyword level.
That page makes 2 points. Quality Score is not a KPI, so do not optimize it or aggregate it with other data. Google also writes "Quality Score is not an input in the ad auction".
The About ad quality page (read November 2, 2026) repeats this: use the score to diagnose weak ads, not to chase the number.
It also says Google's assessment of ad quality is summarized in Quality Score: the score is a diagnostic summary, while the auction uses quality measured at that moment. According to About Quality Score, a dash in the score column means too few exact-match searches to calculate a score, and changing keyword match types does not change the score.
How Ad Rank decides position and price
Google ranks ads with Ad Rank, recalculated on every search. According to the About Ad Rank page (read November 2, 2026), it is calculated twice: first to see whether an ad is eligible to show, then to rank it against other ads.
That page lists 6 factors:
- Bid: the most you are willing to pay for 1 click. What you actually pay is usually lower.
- Ad and landing page quality: usefulness, relevance and ease of navigation.
- Ad Rank thresholds: the minimum an ad must reach to show.
- Auction competitiveness: similar Ad Ranks mean similar chances of winning. A bigger gap makes the higher ad more likely to win, but it may pay more per click.
- Context: the search terms, location, device, time and other ads on the page.
- Expected impact of ad assets, such as a phone number or links to sub-pages.
Google gives a simplified example, not the real formula: with Ad Ranks of 80, 50, 30, 10, -10, -30 and -35 and a minimum of 0 to show, the last 3 advertisers do not show.
On price, the Actual cost-per-click (CPC): Definition page (read November 2, 2026) says you pay only enough to clear the thresholds and beat the ad directly below. So the actual price is usually below your maximum bid. Above the results the threshold is often higher, so the price is often higher than below them.
So why might a rival pay less? The page How the Google Ads auction works (read November 2, 2026) says that even if competitors bid higher, you can still win a higher position at a lower price with relevant keywords, ads and assets.
Conversely, About ad quality says low-quality ads can push the actual price close to the maximum bid, even with little competition. But price also depends on position, context and competition, so Quality Score alone cannot settle the question (Click Star's assessment).
The 3 components and how to read each status
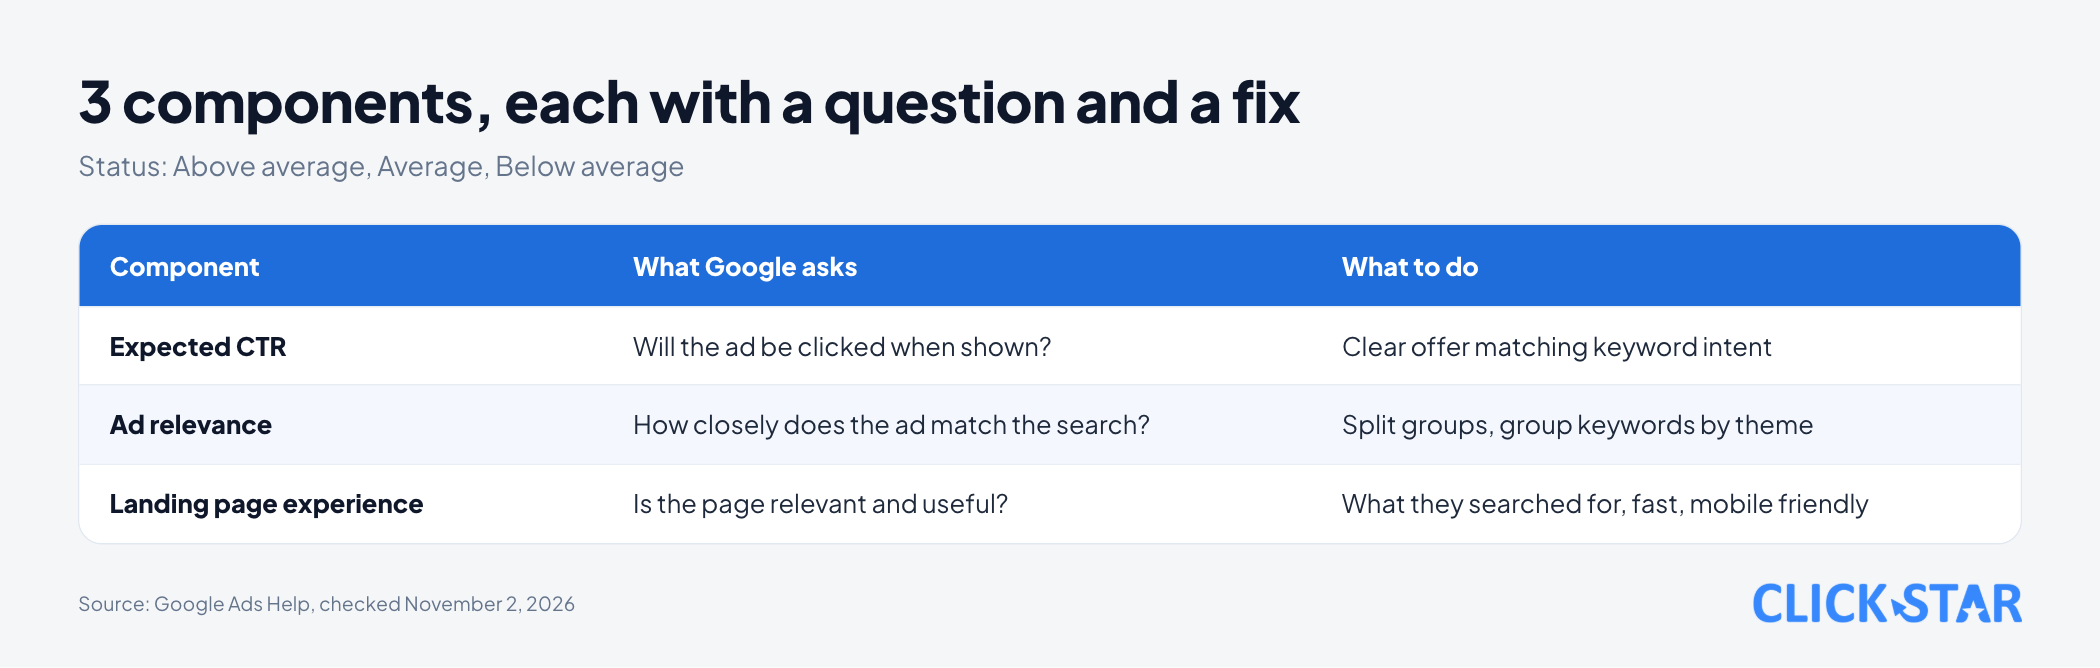
Quality Score is calculated from the combined performance of 3 components, according to About Quality Score. That page compares you with advertisers whose ads showed for the exact same search in the last 90 days, while the definition pages say the comparison is with all other keywords on Google Ads. The pages read give no weights.
- Expected clickthrough rate (expected CTR): how likely the ad is to be clicked when shown.
- Ad relevance: how closely the ad matches the intent behind the search.
- Landing page experience: how relevant and useful the landing page is to people who click.
Each component has 1 status: Above average, Average or Below average. The Vietnamese version of the Google page (Giới thiệu về Điểm chất lượng cho chiến dịch Tìm kiếm, read November 2, 2026) names the 3 statuses Trên trung bình, Trung bình and Dưới trung bình, and calls ad relevance Mức độ phù hợp của quảng cáo.
According to the definition pages for expected CTR and landing page experience, Average or Above average means no major problem, while Below average means you should consider changes. Google's pages still advise improving at Average, so Click Star ranks Average after Below average (Click Star's assessment).
On expected CTR, the Expected clickthrough rate: Definition page (read November 2, 2026) says it is a prediction, not the real rate in the CTR column. It is adjusted to remove the influence of position and assets. The page adds that a keyword can have a high overall score but a low expected CTR, or the reverse, so look at each component.
On landing page experience, the Landing page experience: Definition page (read November 2, 2026) says the page should be clear, useful and related to the keyword.
What to do for each component
Each tip below comes from the page 5 ways to use Quality Score to improve your performance (read November 2, 2026).
Expected clickthrough rate
When this component is Average or Below average:
- Edit the ad text so the offer is more compelling to the target audience.
- Match the details in the ad to the intent of the keyword.
- Highlight 1 unique benefit, such as free shipping, and be more specific.
Google warns that a more specific ad can get fewer clicks but more conversions, so look for the balance.
Ad relevance
When this component is Average or Below average:
- Match the language of the ad more closely to the search terms.
- Split ad groups holding many different keywords into several better-matched groups.
- Group keywords by theme. Google's example is a ring shop: 1 group for "engagement rings" and 1 for "wedding bands".
Landing page experience
When this component is Average or Below average:
- Send people to what they searched for. If someone searches "flannel shirts" and clicks that ad, the page should show flannel shirts.
- Keep the message consistent from ad to page, make the page mobile friendly and improve loading speed.
The search phrase does not need to appear word for word on the page. Conversion rate can serve as a proxy to see whether the page improved, but it does not affect the landing page experience status. Click Star already has articles on website speed and Core Web Vitals.
Things often mistaken for changing Quality Score
The About ad quality page lists 4 things that do not affect ad quality: bidding, account structure (moving an ad group with the same ads and keywords to another campaign), how often ads show, and reported conversions. But moving a keyword to an ad group with new ad text can change quality.
Another confusion is with Ad Strength for responsive search ads. The page About Ad Strength for responsive search ads (read November 2, 2026) says Ad Strength is not used to calculate Ad Rank or Quality Score.
How to view and measure
According to About Quality Score, you view the score under Keywords in the Campaigns menu. Click the columns icon, open the Quality score section and choose Quality Score, Landing Page Exp., Exp. CTR and Ad Relevance. Columns marked (hist.) show past scores.
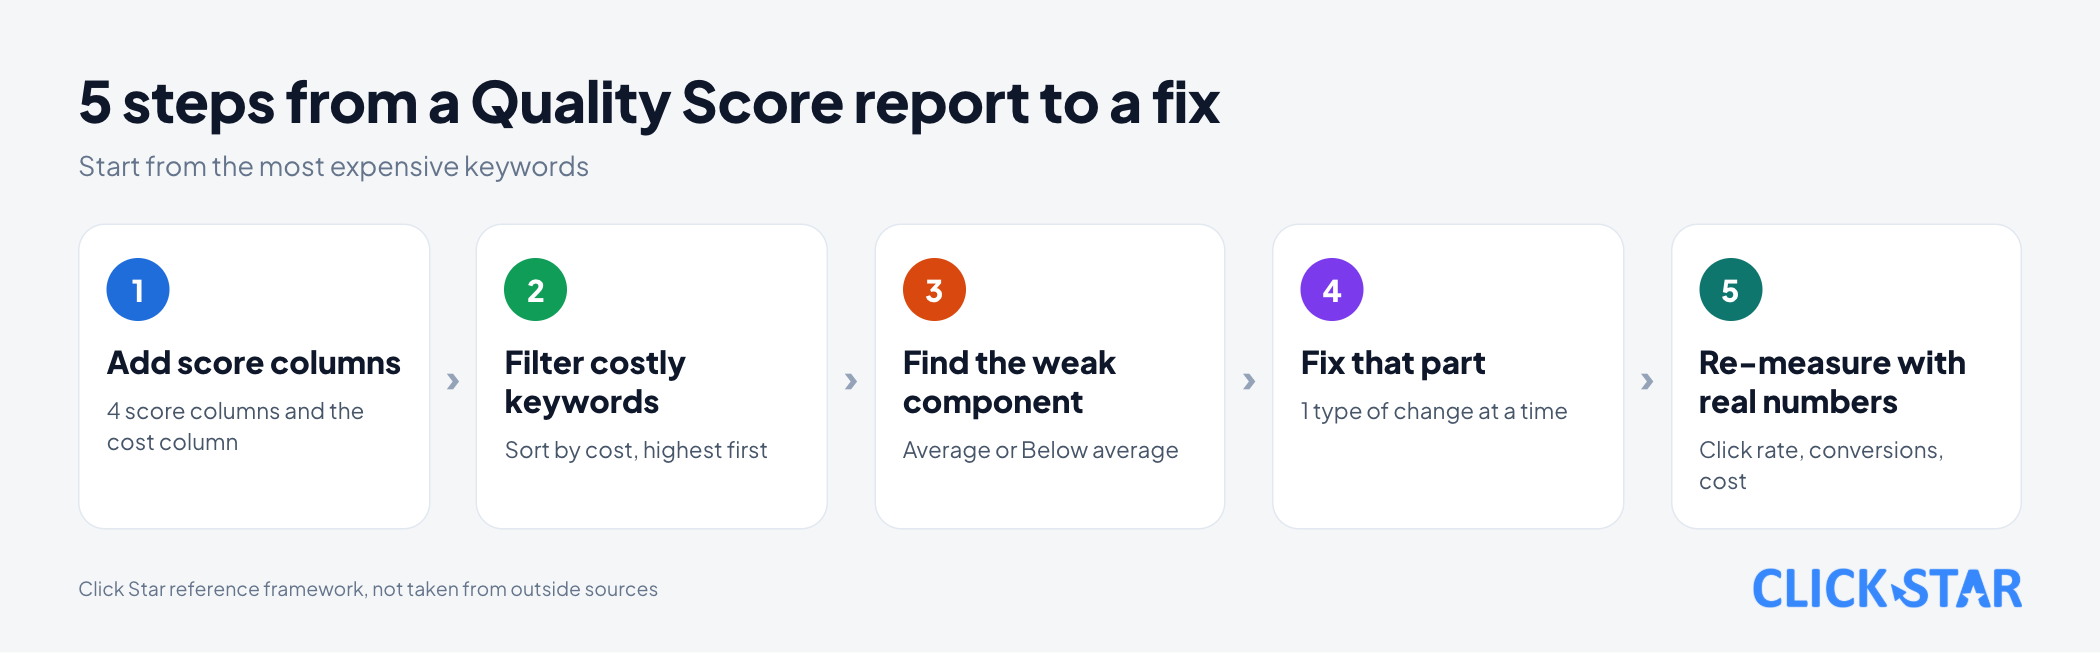
The 5-step process below is Click Star's reference framework, not taken from outside sources:
- Add the 4 score columns and the cost column to the keyword table.
- Filter the most expensive keywords.
- For each keyword, find the component rated Average or Below average.
- Fix that component, 1 type of change at a time.
- Re-measure with real numbers once enough data exists.
Real numbers to track are clickthrough rate (the CTR column), actual cost per click, conversion rate and cost per conversion. Google advises against aggregating Quality Score with your other data.
To compare with rivals, the page Use auction insights to compare performance (read November 2, 2026) describes a report with 6 statistics for Search campaigns, such as overlap rate and outranking share. The list does not include a rival's cost per click.
Vietnam context
Click Star found no measurement of Quality Score or cost per click for Vietnamese businesses in the sources read, so this article gives no "standard" score or reference price.
Read your own Search terms report, then write ads and landing pages the way customers actually type. If most visitors come on phones, test the landing page on a real phone (Click Star's assessment).
Click Star's view. Quality Score is useful as a warning light, not a lever. The right approach is to start from costly keywords, read each component, fix the weak spot and measure with business results.
Click Star offers digital marketing and fast-loading website design services, so it has a related interest.
14-day plan (Click Star's reference framework)
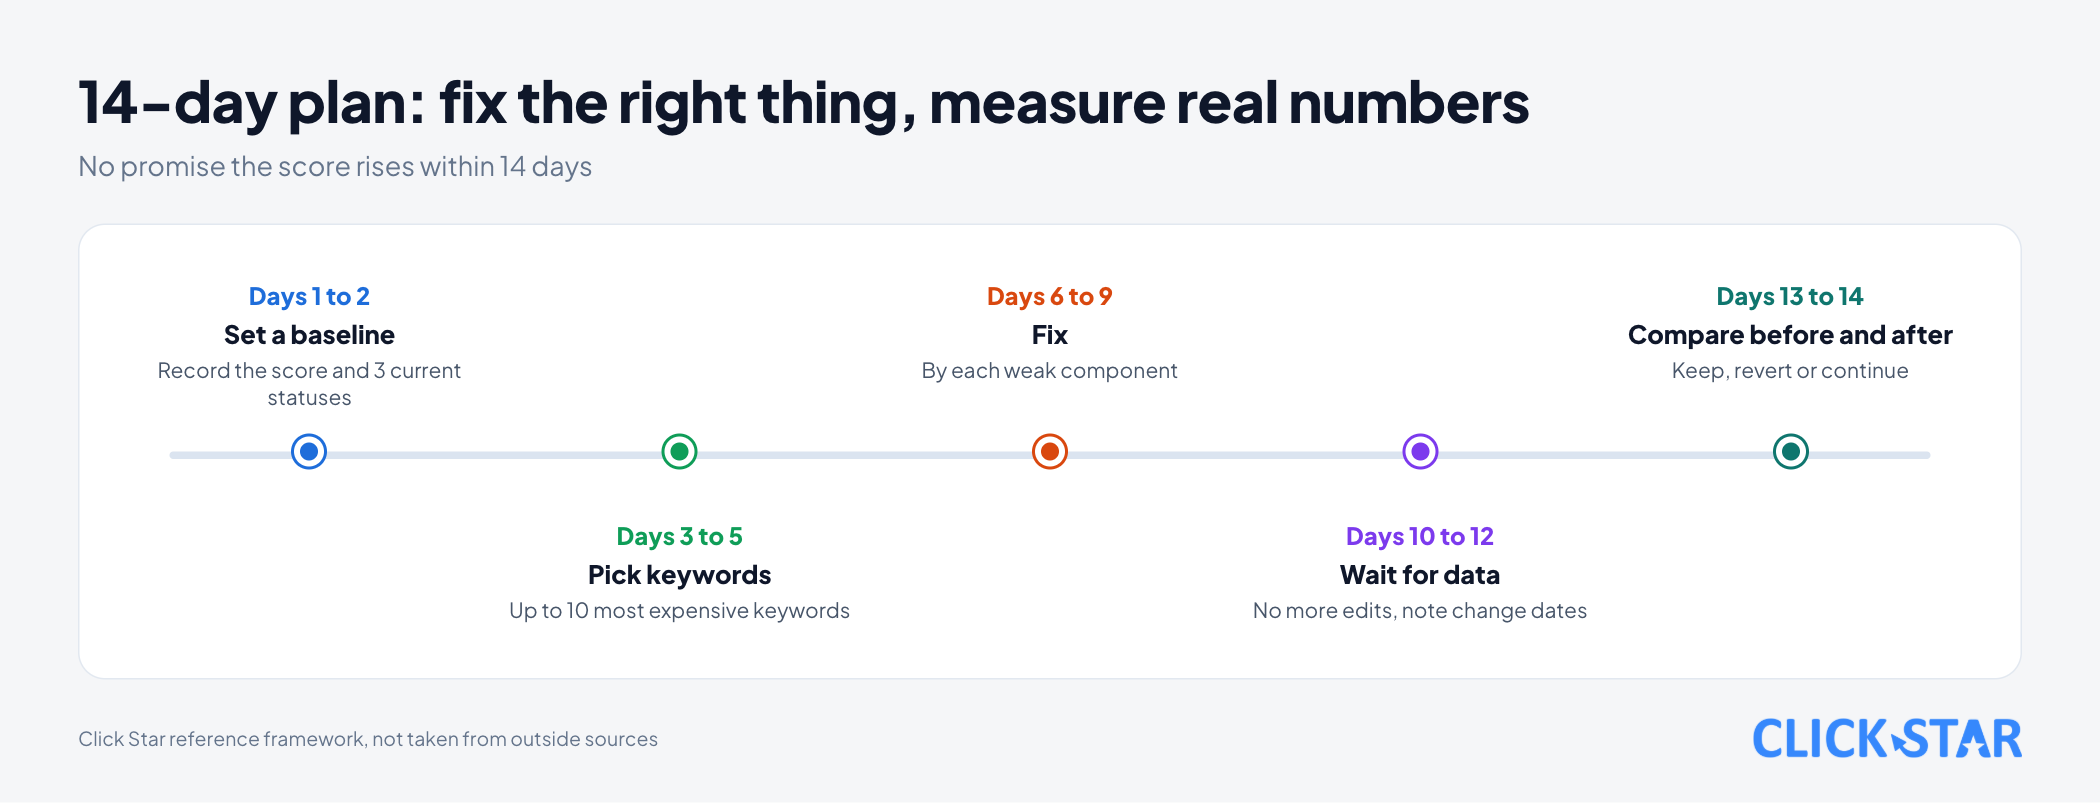
Google says the comparison group for the components covers the last 90 days, and Click Star has no source on how fast the score updates after a fix. This plan does not promise the score will rise within 14 days.
- Days 1 to 2: add the score columns, export the keyword table with cost, and record the current score and 3 statuses as a baseline.
- Days 3 to 5: pick up to 10 of the most expensive keywords with a weak component and write a hypothesis for each.
- Days 6 to 9: fix by component. Split groups for relevance, change the offer for click rate, fix the page and speed for landing page experience.
- Days 10 to 12: wait for data, change nothing more, and note the dates of changes.
- Days 13 to 14: compare click rate, actual price, conversion rate and cost per conversion with the day 1 baseline, then decide to keep, revert or continue. Keywords with few clicks give noisy numbers, so wait for enough clicks.
Common mistakes
- Treating Quality Score as a KPI and chasing 10/10.
- Assuming a higher bid raises Quality Score.
- Looking only at the overall score, not the 3 components.
- Changing many things at once, so nobody knows which change worked.
- Putting many topics into the same ad group.
- Sending visitors to the home page instead of a page matching the keyword.
- Confusing Ad Strength with Quality Score.
What is not known
Click Star has no measurement of Quality Score or cost per click for Vietnamese businesses, and no source stating a "good" score or the price reduction tied to any score.
It is unclear what weights the 3 components carry, how fast the score updates after a fix, and whether the 2 descriptions of the comparison group really differ. The Google Ads Help pages read show no update date.
Related posts
Need tailored advice for your business?
Click Star helps you build a solution that fits your industry and scale. We answer every question during business hours.