Website Monitoring: Uptime Checks, Logs and Alerts to Catch Errors Before Customers
The layers of website monitoring, the 4 signals to measure, how to write logs and set actionable alerts, based on the Google SRE book, OWASP, and Vercel and Supabase documentation.
Suppose a website stops serving at 2 a.m. Without monitoring, the first to know may be a customer sending a message, or a salesperson reporting that the form will not submit. Monitoring makes the system report its own failures before outsiders do.
This article covers the layers of monitoring, the 4 signals worth tracking per the Google SRE book, how to write logs without recording excess sensitive data, and how to set few but actionable alerts. Sources are the Google SRE book and Google, Vercel, Supabase, OWASP and DORA documentation, checked on October 23, 2026.
Click Star already has articles on backup and recovery (RPO, RTO), webhooks, CI/CD and website security; this one is about knowing a website is broken. It names no price for any monitoring service.
Key points
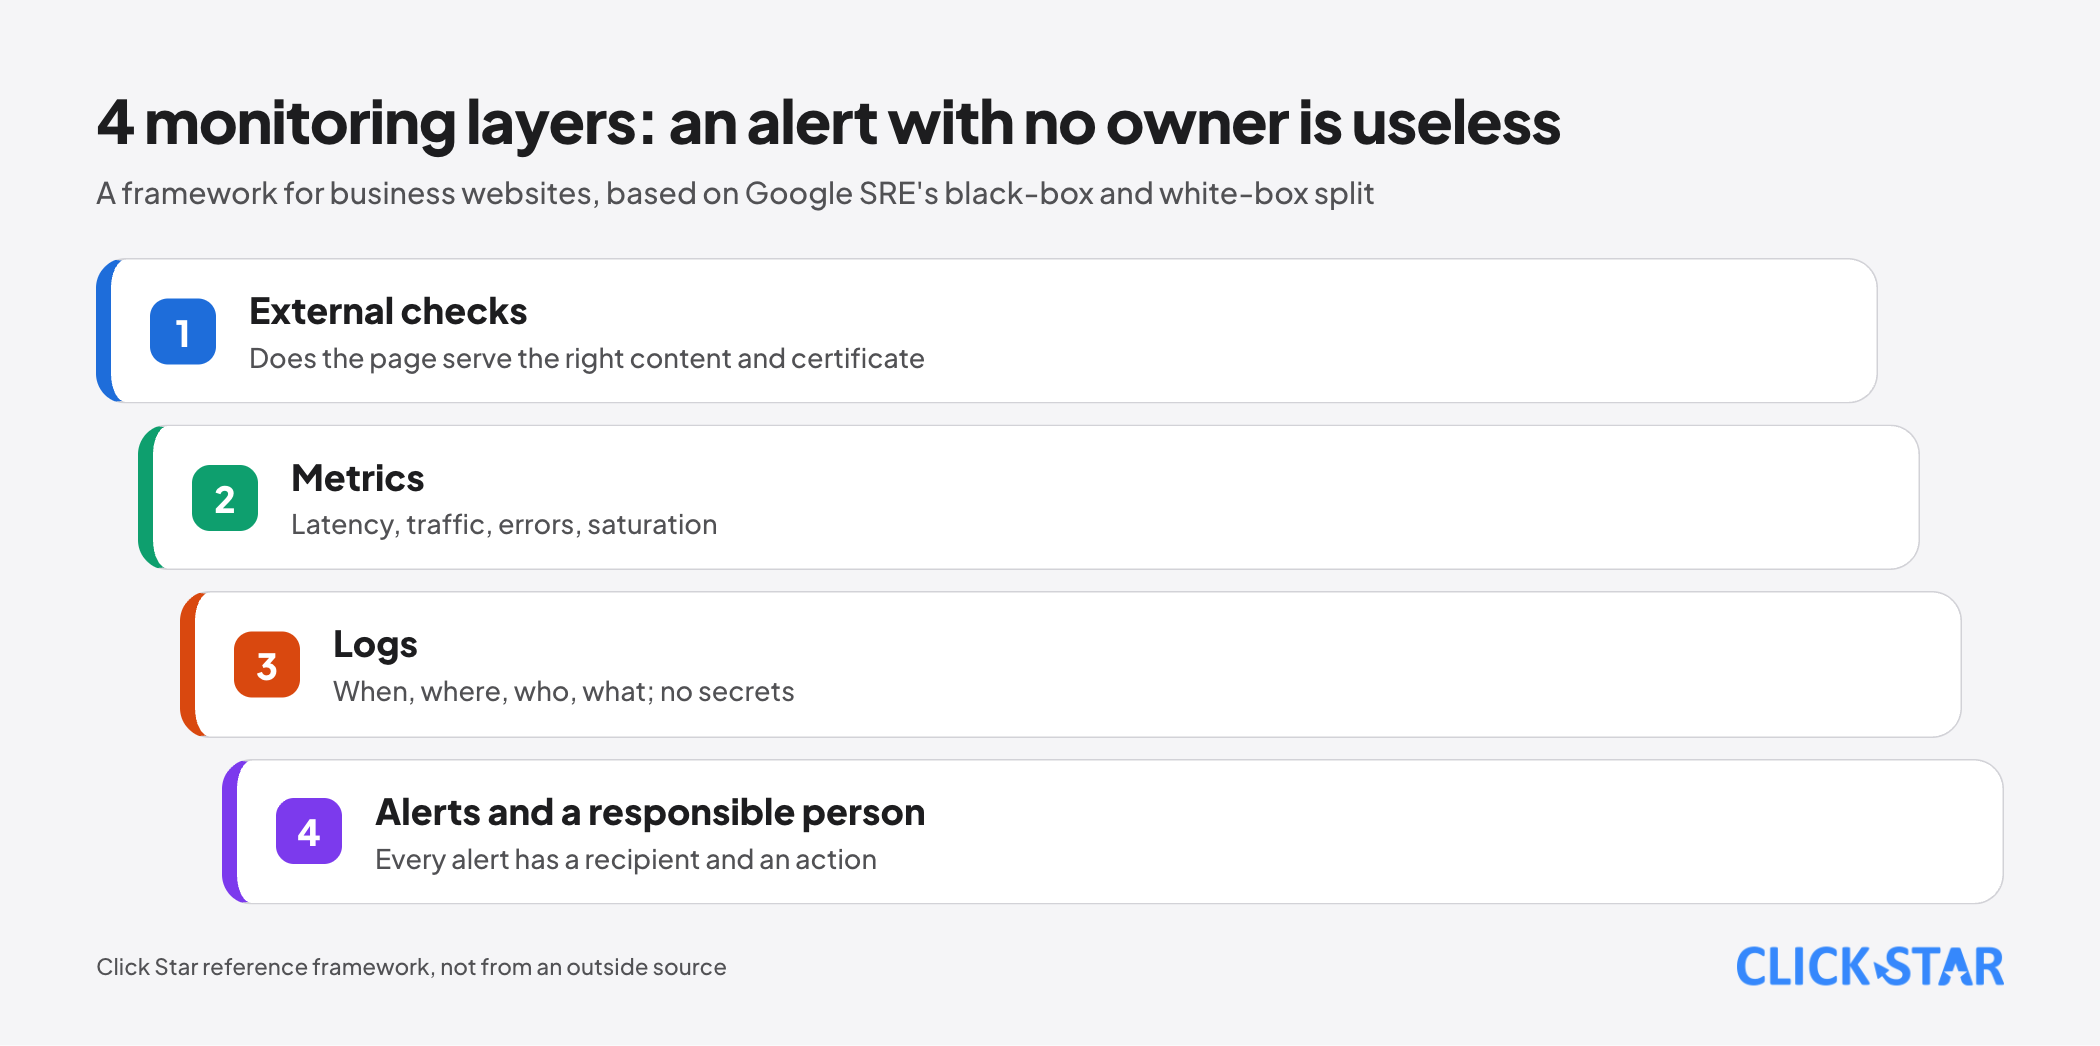
- Monitoring has 4 layers in Click Star's framework: external checks, metrics, logs, and alerts with a person who acts. Without the last, the first 3 are screens nobody watches.
- The Google SRE book chooses 4 signals: latency, traffic, errors and saturation. Alerts should follow symptoms users see; causes are for diagnosis.
- An HTTP 200 is not proof of health: the book notes a failure can be a 200 with the wrong content. External checks need content matching and certificate expiry.
- Logs should be structured and record when, where, who and what; per OWASP, passwords, tokens, card data and sensitive personal data should usually not be logged directly.
- Per Vercel documentation (updated August 28, 2026), runtime logs are kept 1 hour on Hobby and 1 day on Pro; investigating older incidents usually needs a store outside the platform.
- Google SRE asks that every alert that wakes a person be actionable; too many alerts lead on-call staff to ignore even the real ones.
What layers does website monitoring have
Per chapter 6 of the Google SRE book (1st ed., 2016), monitoring is collecting, processing and displaying real-time quantitative data about a system, such as request counts, error counts and processing times. The book distinguishes black-box monitoring (behavior as a user sees it from outside) from white-box monitoring (metrics and logs from inside).
Black-box reports problems that are happening now; white-box helps see problems about to happen and failures masked by retries.
From this Click Star uses a 4-layer framework (a Click Star reference framework, not from an outside source): external checks, metrics, logs, and alerts with a responsible person. The last layer is easy to forget: an alert sent to an inbox nobody reads is no alert.
The 4 golden signals: what to measure first
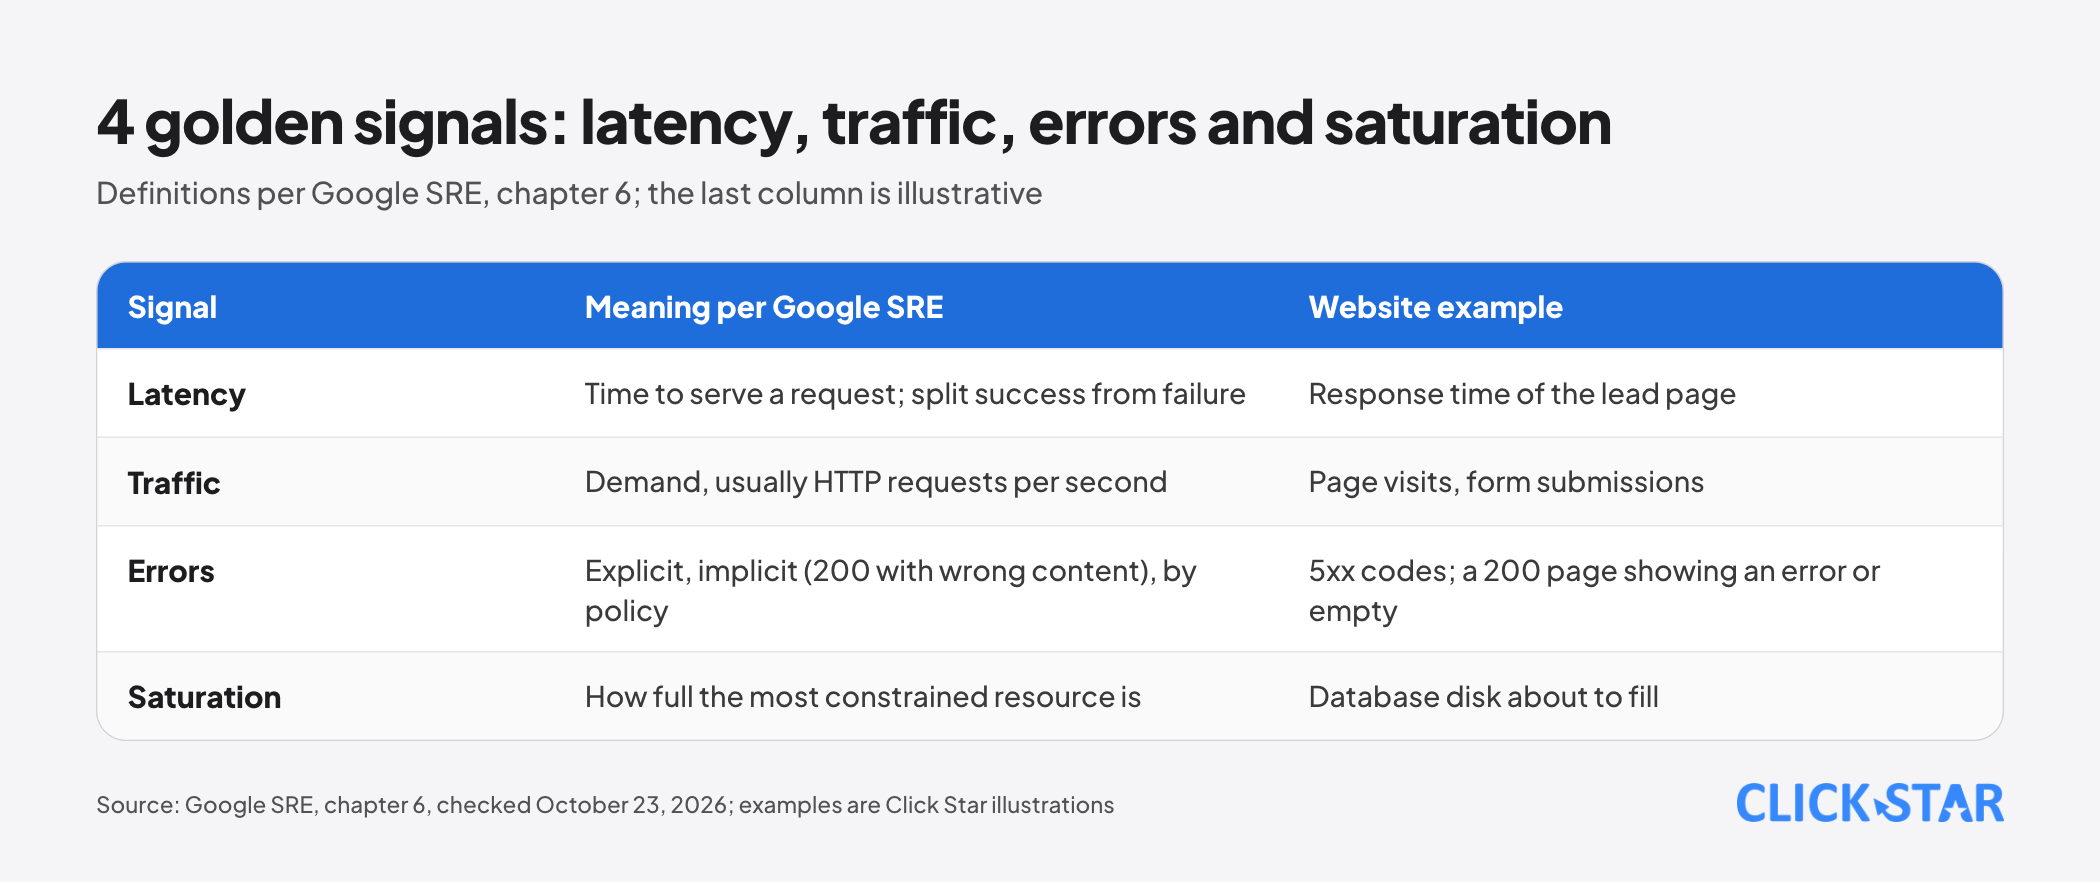
If you can measure only 4 metrics for a user-facing system, the Google SRE book picks latency, traffic, errors and saturation.
Latency should separate successful requests from failed ones, because a 500 can return very fast and make latency calculations misleading; a slow error is worse than a fast one. Traffic is the demand on the system, usually HTTP requests per second for a website.
Errors come in 3 kinds: explicit (such as 500), implicit (a 200 with the wrong content) and by policy (if a 1-second response was promised, anything over 1 second is an error). Implicit errors only show up in end-to-end checks.
Saturation shows how full the most constrained resource is; the book's example is an alert that the database disk will fill in 4 hours.
The book warns against averages: a service with 100 ms average latency at 1,000 requests per second can still have 1% of requests taking 5 seconds.
The book also separates symptoms from causes: "serving 500 errors" is a symptom, "database refusing connections" is a cause. Alerts should follow symptoms, while causes belong on diagnostic dashboards.
External checks and real user data
These 2 methods answer different questions: "can the page be served" and "how are real customers experiencing it".
Google Cloud's Create public uptime checks documentation (updated October 22, 2026) is an example of the capability, not a product recommendation. The check sends HTTP, HTTPS or TCP requests periodically from several locations; it succeeds when the status matches the criteria and, if content matching is on, the response holds the required content.
For HTTPS, the tool validates the certificate by default (expired, self-signed or wrong-domain certificates fail) and exposes a metric for alerting before expiry. The check does not load page assets or run JavaScript.
Low-traffic websites have their own problem. Per the Google SRE Workbook (chapter Alerting on SLOs, 2018 print), a system receiving 10 requests an hour sees 1 failed request as a 10% error rate for that hour. The book suggests artificial traffic, but warns that successful artificial requests can hide errors only real customers hit.
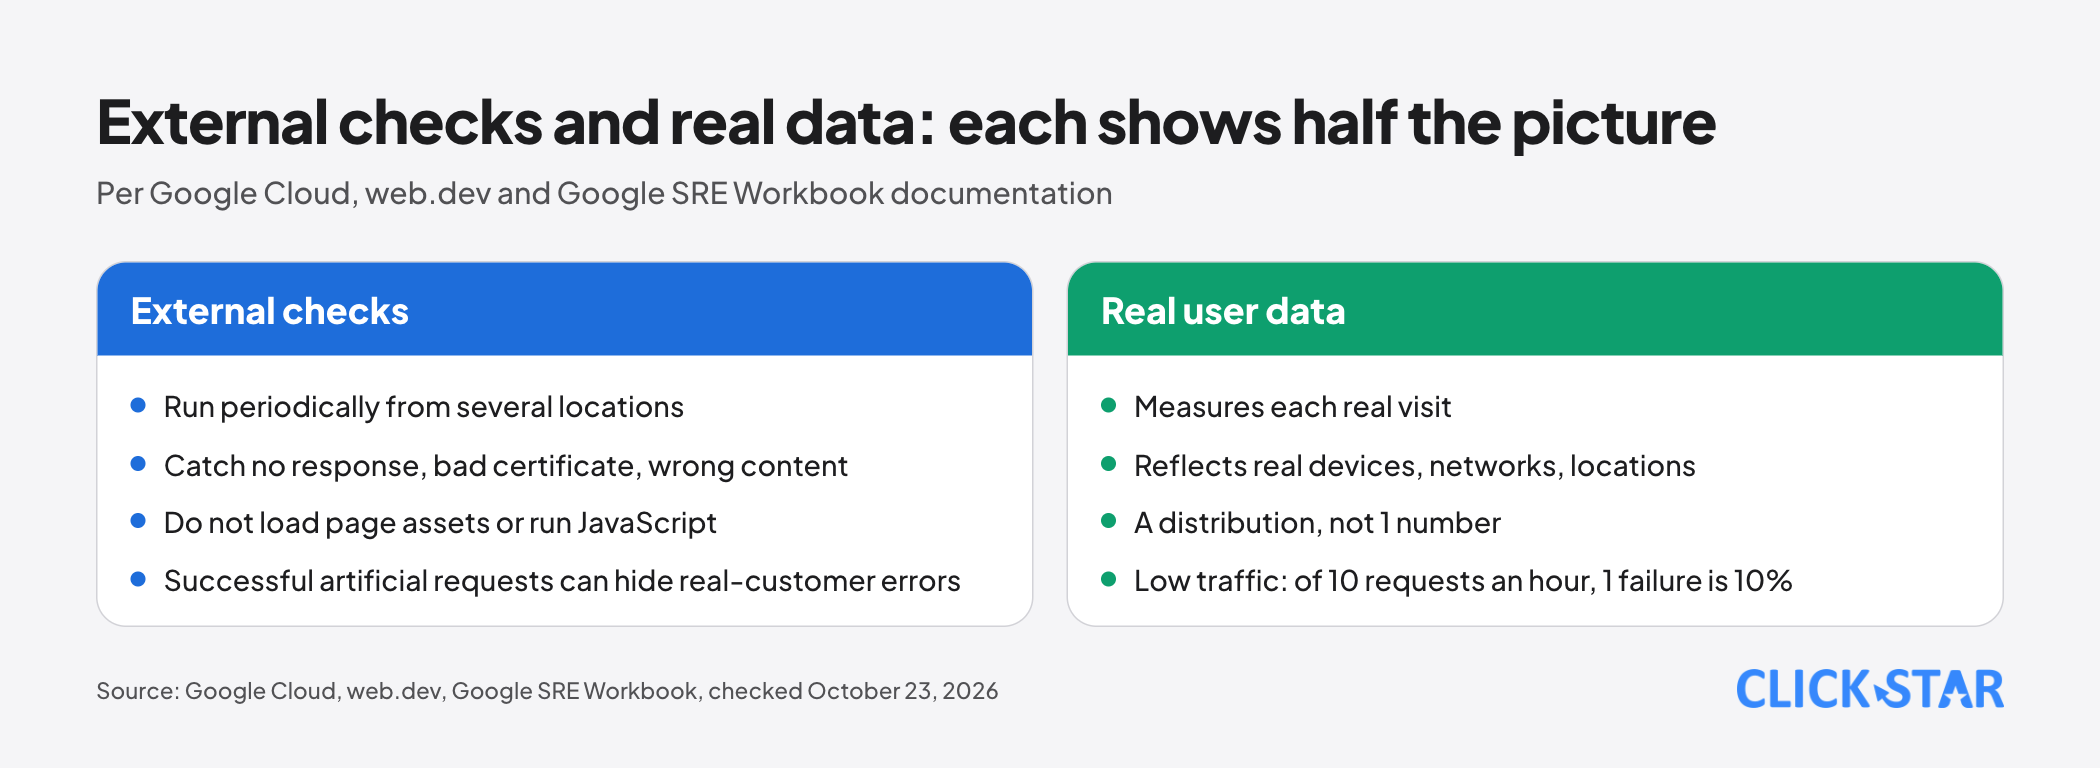
Per web.dev (updated July 18, 2022), real user data (field data, or RUM) measures each actual visit, so it reflects real devices, networks and locations, and is a distribution, not 1 number. Lab data runs on 1 device, 1 network and 1 location, and suits debugging.
Note (Click Star's inference): automated checks mix into traffic figures unless labeled (OWASP advises labeling, not excluding, them), and test forms will create fake leads in the CRM.
How Google sees a website incident
Per How HTTP Status Codes Affect Google's Crawlers (Google Crawling Infrastructure, updated February 4, 2026), 5xx and 429 responses make crawlers slow down temporarily; URLs that persistently return server errors are removed from the index; once the server returns 2xx again, crawling gradually speeds up. A 200 page showing an error message or empty can be reported as a soft 404.
Logs: what to record and what not to
Per OWASP's Logging Cheat Sheet (no date shown, read October 23, 2026), each log line should answer "when, where, who, what", with an interaction identifier linking the events of 1 request. Record logins, authorization failures, application and system errors, and configuration changes; a blind checklist approach creates "alarm fog".
To resist log injection, OWASP recommends structured formats such as JSON and limiting the length of user-supplied values. A Click Star illustration, not a mandatory format:
{"time":"2026-10-23T08:15:02Z","level":"error","route":"/api/lead","status":500,"actor":"anon","request_id":"req-8f21","message":"CRM timeout"}
OWASP lists things usually not to be recorded directly but removed, masked, hashed or encrypted: passwords, access tokens, session identifiers, database connection strings, encryption keys, card data, sensitive personal data. Names, phone numbers and emails may need special handling. This article cites no Vietnamese statute; check the original text.
Platform limits, per current documentation:
- Vercel Runtime Logs (updated August 28, 2026) keep Hobby 1 hour, Pro 1 day, Pro with Observability Plus 30 days (up to 14 consecutive days viewable), Enterprise 3 days. Log details include URL search parameters, so keep personal data out of URLs.
- Vercel Drains (updated September 1, 2026, Pro and Enterprise plans) forward logs to external services for longer retention. Supabase has log drains for Pro, Team and Enterprise plans; retention depends on the plan.
Few alerts, each one actionable
Per chapter 6, paging a human is expensive; when alerts are frequent, on-call staff skim or ignore them, including real ones. The book says never to alert merely because "something seems a bit weird" (except security auditing of very narrow components). Click Star condenses the book's questions to ask before creating an alert rule:
- Does the rule detect an urgent, actionable condition that is affecting or about to affect users?
- Are there benign cases where the rule fires but users are not affected?
- Can the recipient do something now, or can it wait until morning?
The book adds: if the response is merely robotic, it should not be a page that wakes someone.
For teams with a service level objective (SLO), the Workbook describes alerting on the burn rate of the error budget. It says many parameters make rules hard to manage; Click Star sees small businesses as not needing to start here.
On-call people and the incident process
The Managing Incidents chapter of the Google SRE book defines 4 roles: command, operations, communication and planning. Only operations changes the system during an incident, and the incident commander's handoff must be explicit and acknowledged.
A small team can let 1 person hold several roles, as long as each role has a named person before an incident occurs. Click Star's 5-step framework: detect, confirm, mitigate, notify, review.
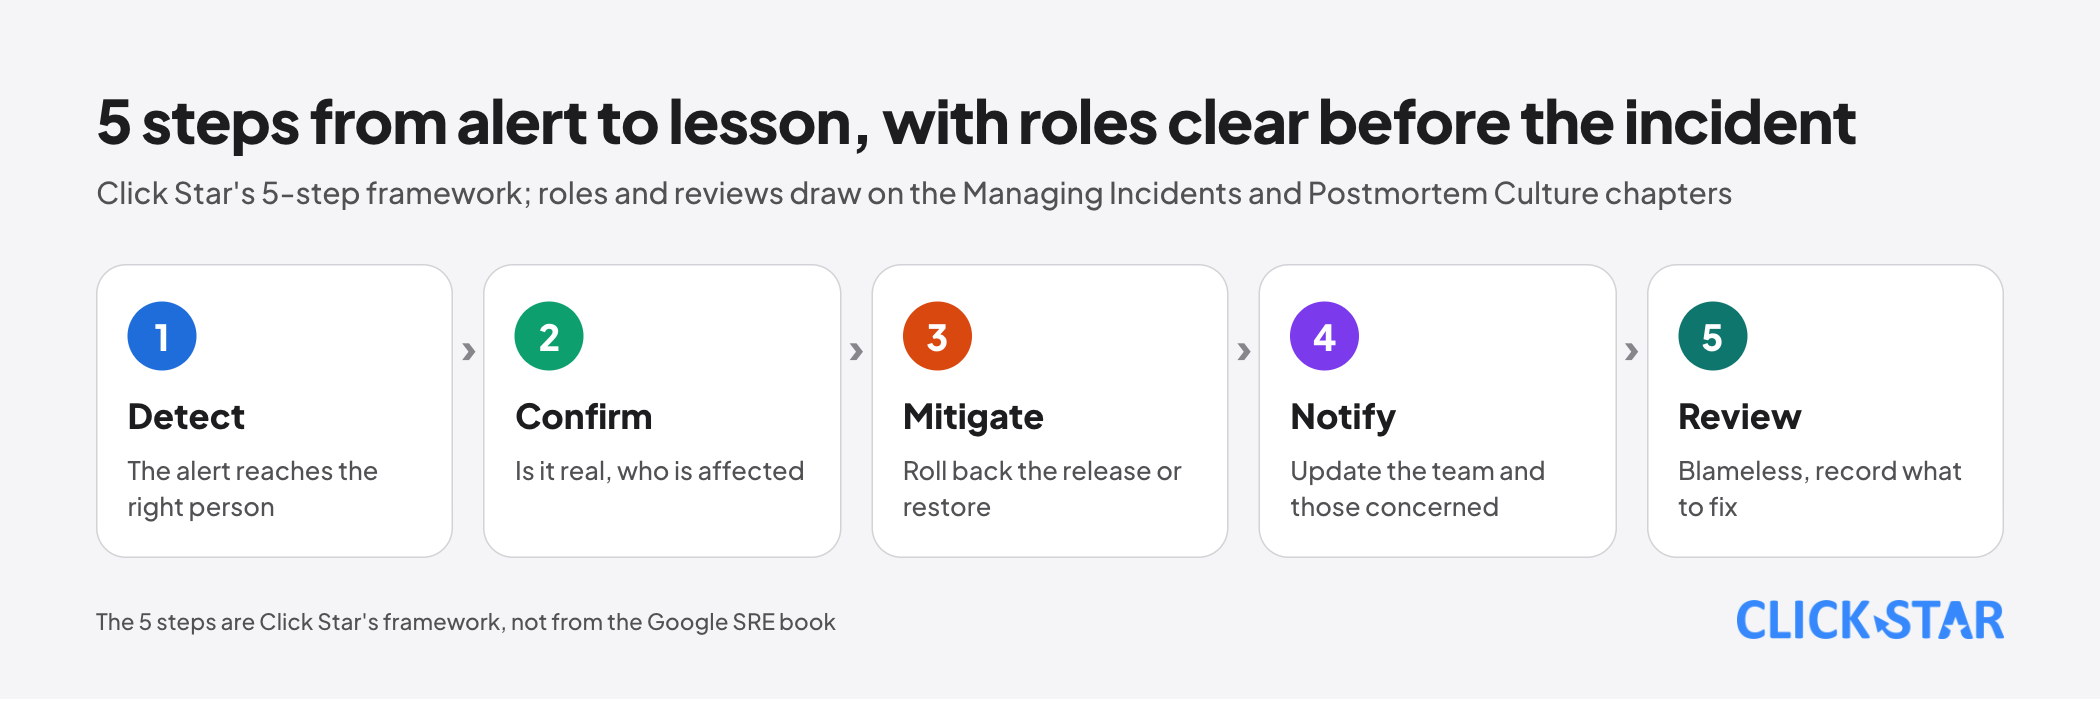
The Postmortem Culture chapter recommends blameless reviews and triggers set in advance, such as data loss, engineer intervention (rolling back a release), resolution time over a threshold, and a monitoring failure (usually an incident found manually).
If customers reported it before the system did, that is 1 signal to fix (Click Star's inference).
For Vietnamese businesses: where to start
The framework below is Click Star's, not from an outside source. Failures in forms, booking or payment deserve priority over an about page, because that is where customers arrive (inference).
- Level 1, minimum: external checks for the homepage and lead page (with content matching), a certificate-expiry alert, and alerts to at least 2 people.
- Level 2, medium: add an off-platform log store, the 4-signal board, error-rate alerts, and real user data.
- Level 3, advanced: SLOs, an on-call schedule, drills, and a mandatory review after incidents that meet the triggers.
Click Star's view. Monitoring works when it changes team behavior: who receives the alert, what they do, how fast. A tool cannot replace that, and more alerts do not mean more safety.
A sensible starting point is level 1 for the path that brings in leads. Click Star offers SEO-ready fast website design, custom software and data dashboards, so it has an interest in this topic.
30-day plan and how to measure
A Click Star reference framework, not taken from an outside source:
- Week 1: list 3 to 5 critical paths, name the alert recipient and a backup, and set up external checks with content matching and certificate expiry.
- Week 2: find where logs are viewed, how long they are kept, and how to export them; review logs to remove personal data and secrets.
- Week 3: set alerts for symptoms (error rate, the lead path) and write a 1-page response guide for each alert.
- Week 4: drill 1 fake incident, measure the time from failure to someone acting, and cut alerts that are not actionable.
Measures (also Click Star's framework): time to detect, time to restore per incident, the share of incidents customers report before the system, and alerts per week with the share needing action.
For incidents caused by a bad release, DORA (updated January 5, 2026) measures failed deployment recovery time, replacing the older MTTR metric.
Common mistakes
- Checking only "does the server answer" without content matching or passing through the form.
- Alerting on causes that may not affect users (high CPU) instead of symptoms users see.
- Relying on averages and missing the slow tail.
- Sending every alert to 1 shared channel where nobody owns it.
- Not knowing how long logs are kept, then finding them gone when an investigation starts.
- Writing passwords, tokens, card data or customers' personal data into logs.
- Never drilling, so the response guide is first read during a real incident.
What is not known
Click Star has no public measurement of the frequency, duration and cost of website incidents at Vietnamese businesses, nor of how widely monitoring is adopted.
The 4-layer framework, 3 levels and 30-day plan are Click Star proposals. The Google SRE book targets large-scale systems; Click Star has no public source on applying its parameters unchanged to small websites, and has not read monitoring documentation beyond Vercel, Supabase and Google Cloud.
Related posts
Need tailored advice for your business?
Click Star helps you build a solution that fits your industry and scale. We answer every question during business hours.