INP explained: how to measure website responsiveness and fix slow interactions
What INP measures, the 200-millisecond threshold, how to measure it with field data and DevTools, and how to fix each of the 3 parts of an interaction, based on web.dev, Google and the 2025 Web Almanac.
Sales and booking websites can be slow in a place that is rarely measured: the visitor taps a button and nothing on screen changes. INP (Interaction to Next Paint) measures exactly that moment and is the responsiveness metric in Google's Core Web Vitals.
This article explains what INP measures, its thresholds, which tools measure it and how to fix each part of an interaction. The main sources are web.dev, Chrome for Developers, Google Search Central and the 2025 Web Almanac, checked on October 23, 2026.
Click Star already has articles on Core Web Vitals, image optimization and Google Tag Manager; this one goes deep on INP. Click Star sells fast, SEO-ready website design, so it has an interest in the topic.
Key points
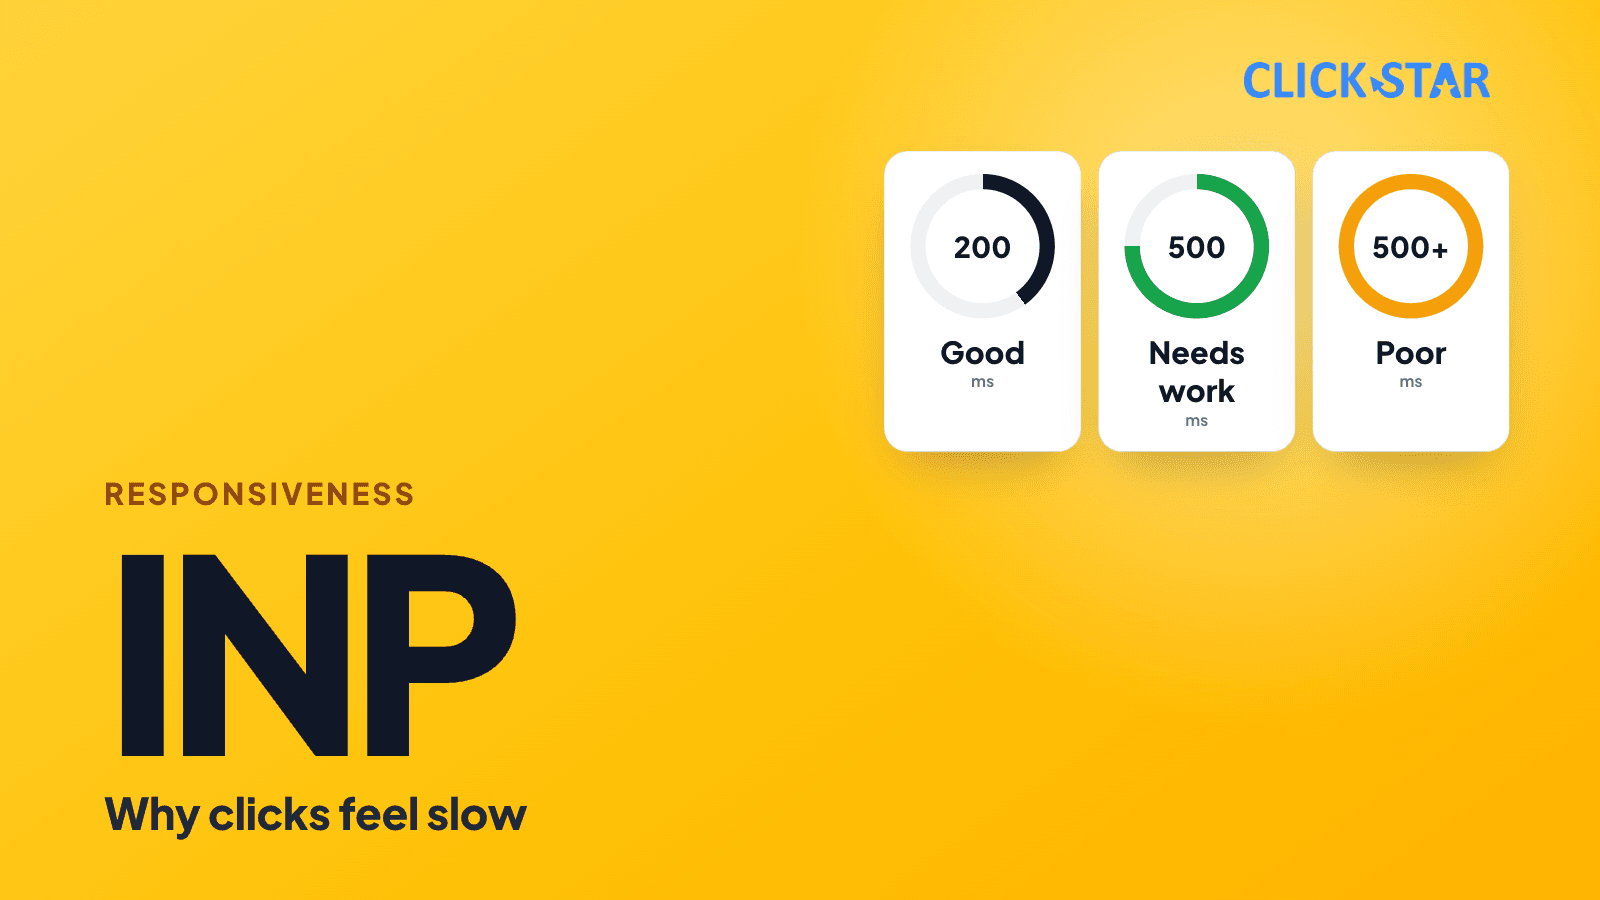
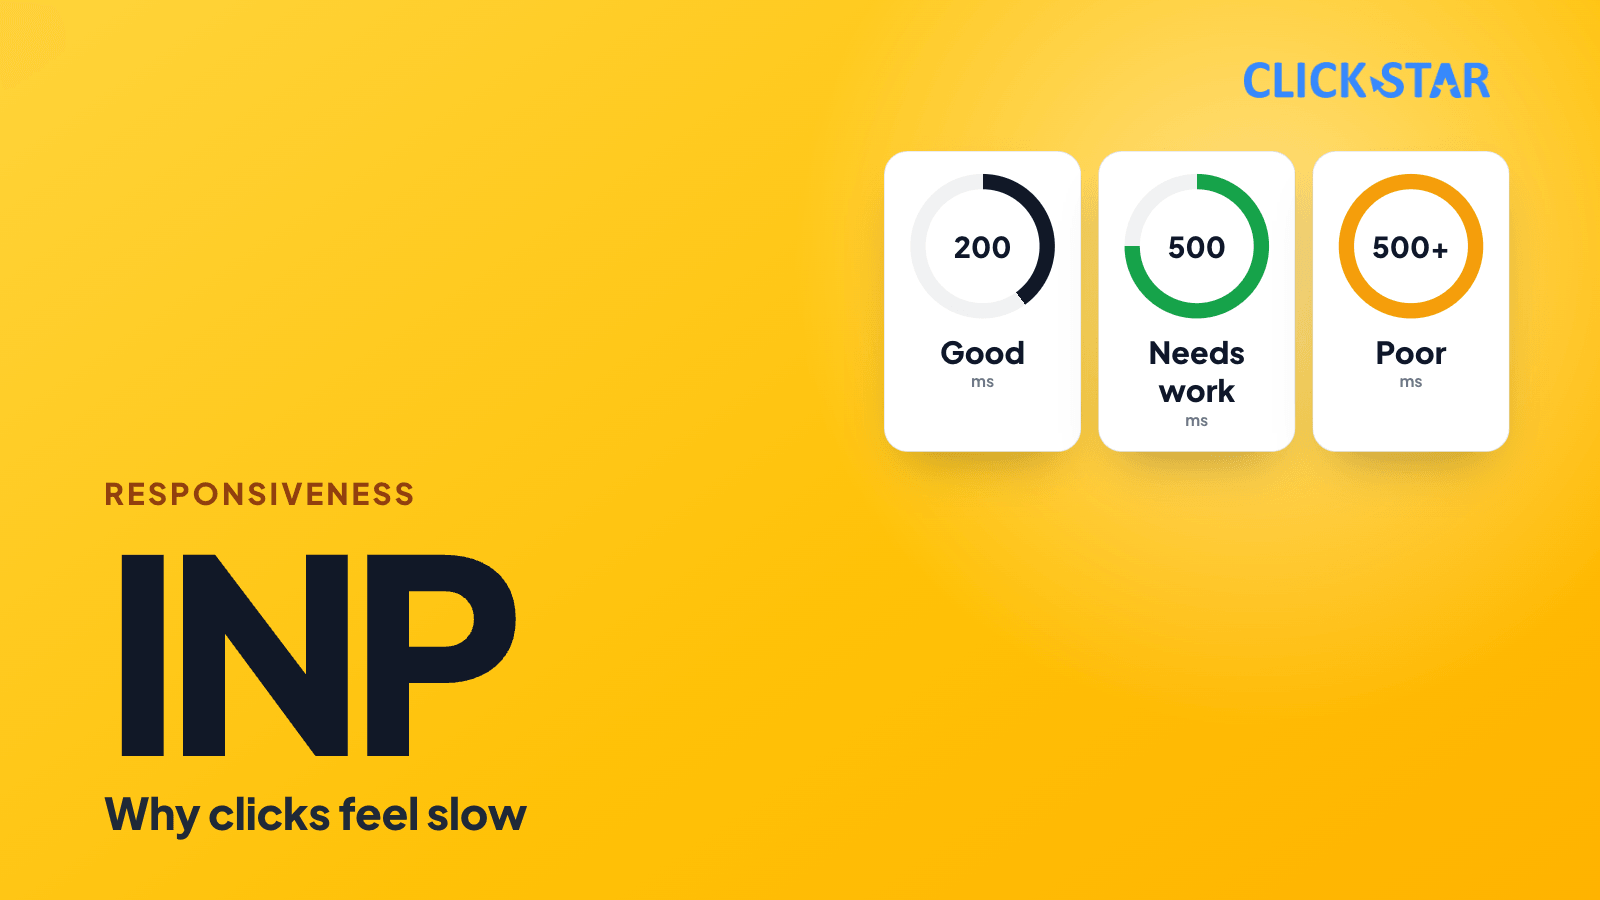
- INP measures the time from a click, tap or key press to the next painted frame. Good is 200 milliseconds or less, poor is above 500, at the 75th percentile of page views.
- INP replaced FID as a Core Web Vital on March 12, 2024. FID measured only the first interaction; INP observes every interaction during the visit.
- Each interaction has 3 parts: input delay, processing time and presentation delay. Knowing which is slow shows what to fix.
- Start with field data (PageSpeed Insights, Search Console), then debug in DevTools. Lighthouse in page-load mode does not measure INP because no user interacts.
- Per the 2025 Web Almanac, 77% of mobile and 97% of desktop websites have good INP (July 2025 data, websites in CrUX only). Click Star found no figure for Vietnam.
- Fixing INP is often about breaking up JavaScript on the main thread: split long tasks, defer third-party scripts, keep the DOM small. Google says good Core Web Vitals do not guarantee high rankings.
What INP is and how it differs from FID
According to web.dev (updated September 2, 2025, read October 23, 2026), INP observes the latency of every mouse click, screen tap and key press during the page visit. The final value is the slowest interaction, with outliers ignored: for every 50 interactions, the slowest 1 is dropped.
The page value is reported at the 75th percentile of page views, meaning 3 in 4 views meet that level or better. Hovering, zooming and scrolling are not counted; a page with no interactions, or visited only by a bot, has no INP value.
Web.dev's thresholds: 200 milliseconds or less is good, above 200 up to 500 needs improvement, above 500 is poor. The Search Console help page (read October 23, 2026) uses the same thresholds.
FID, the predecessor, measured only the wait before the first interaction. The web.dev announcement (updated January 31, 2024) says INP replaced FID on March 12, 2024. The Chromium INP changelog (read October 23, 2026) has no line about a threshold change.
The 3 parts of an interaction
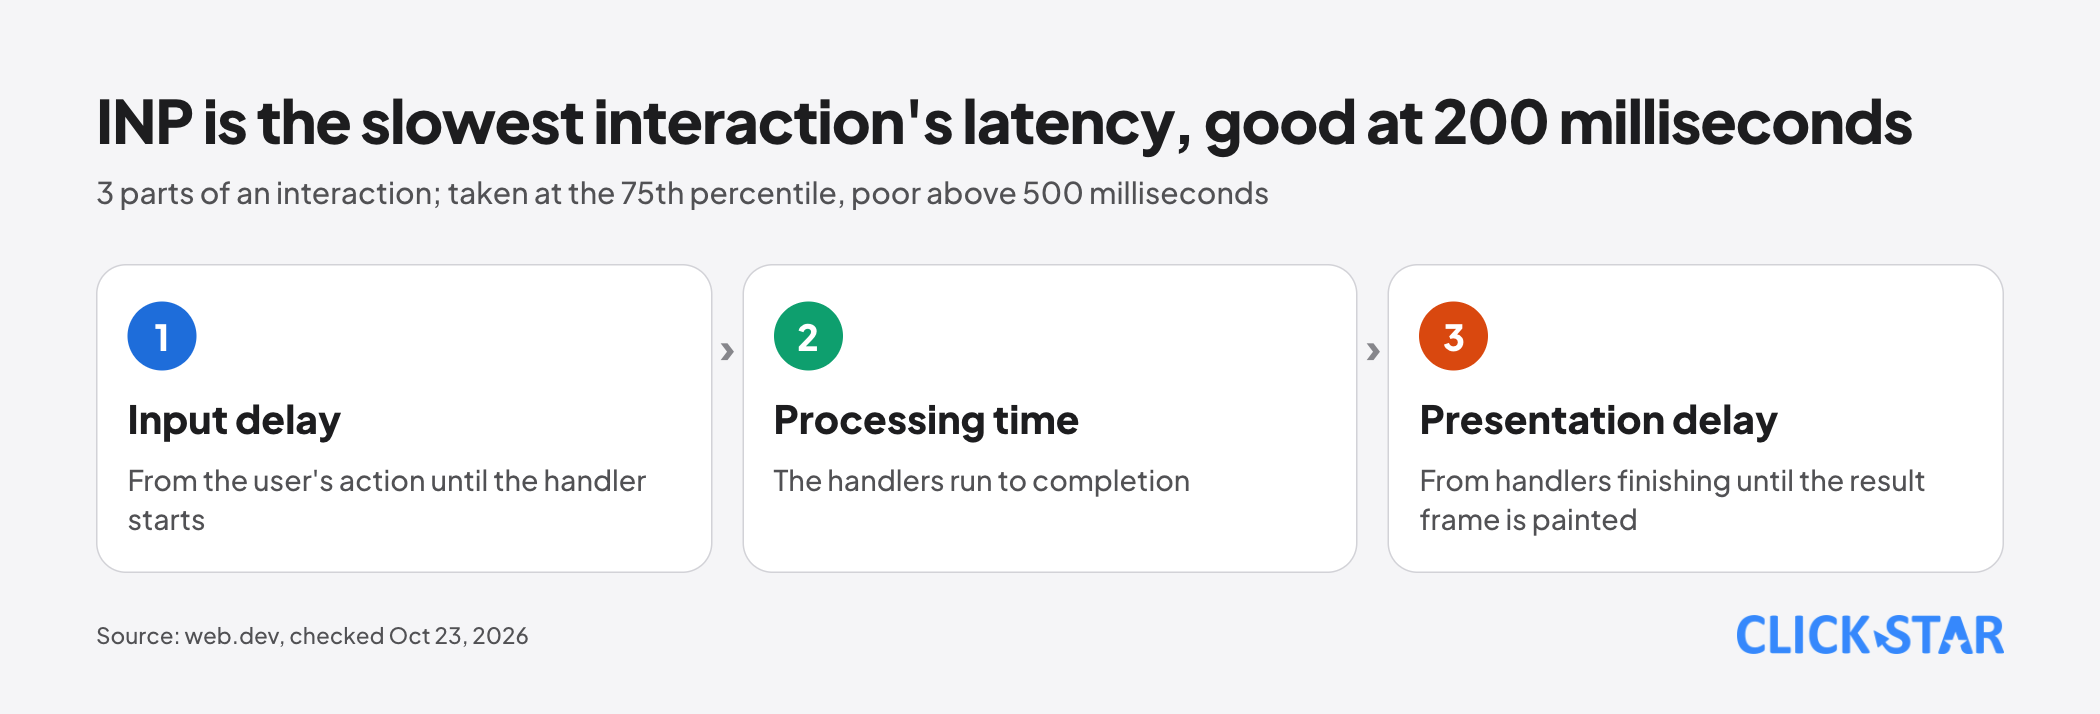
Web.dev splits an interaction's latency into 3 parts that sum to it. Part 1 is input delay: from the user's action until the event handler starts. Part 2 is processing duration: the handlers running to completion.
Part 3 is presentation delay: from the handlers finishing until the browser paints the frame that shows the result.
The split matters because each part is fixed differently: high input delay usually means the main thread is busy, slow processing comes from the code in the handler, and high presentation delay comes from heavy rendering.
Measure INP with field data first, lab data second
Field data
Web.dev recommends starting with real-user data, because the lab only reflects the interactions the tester performs.
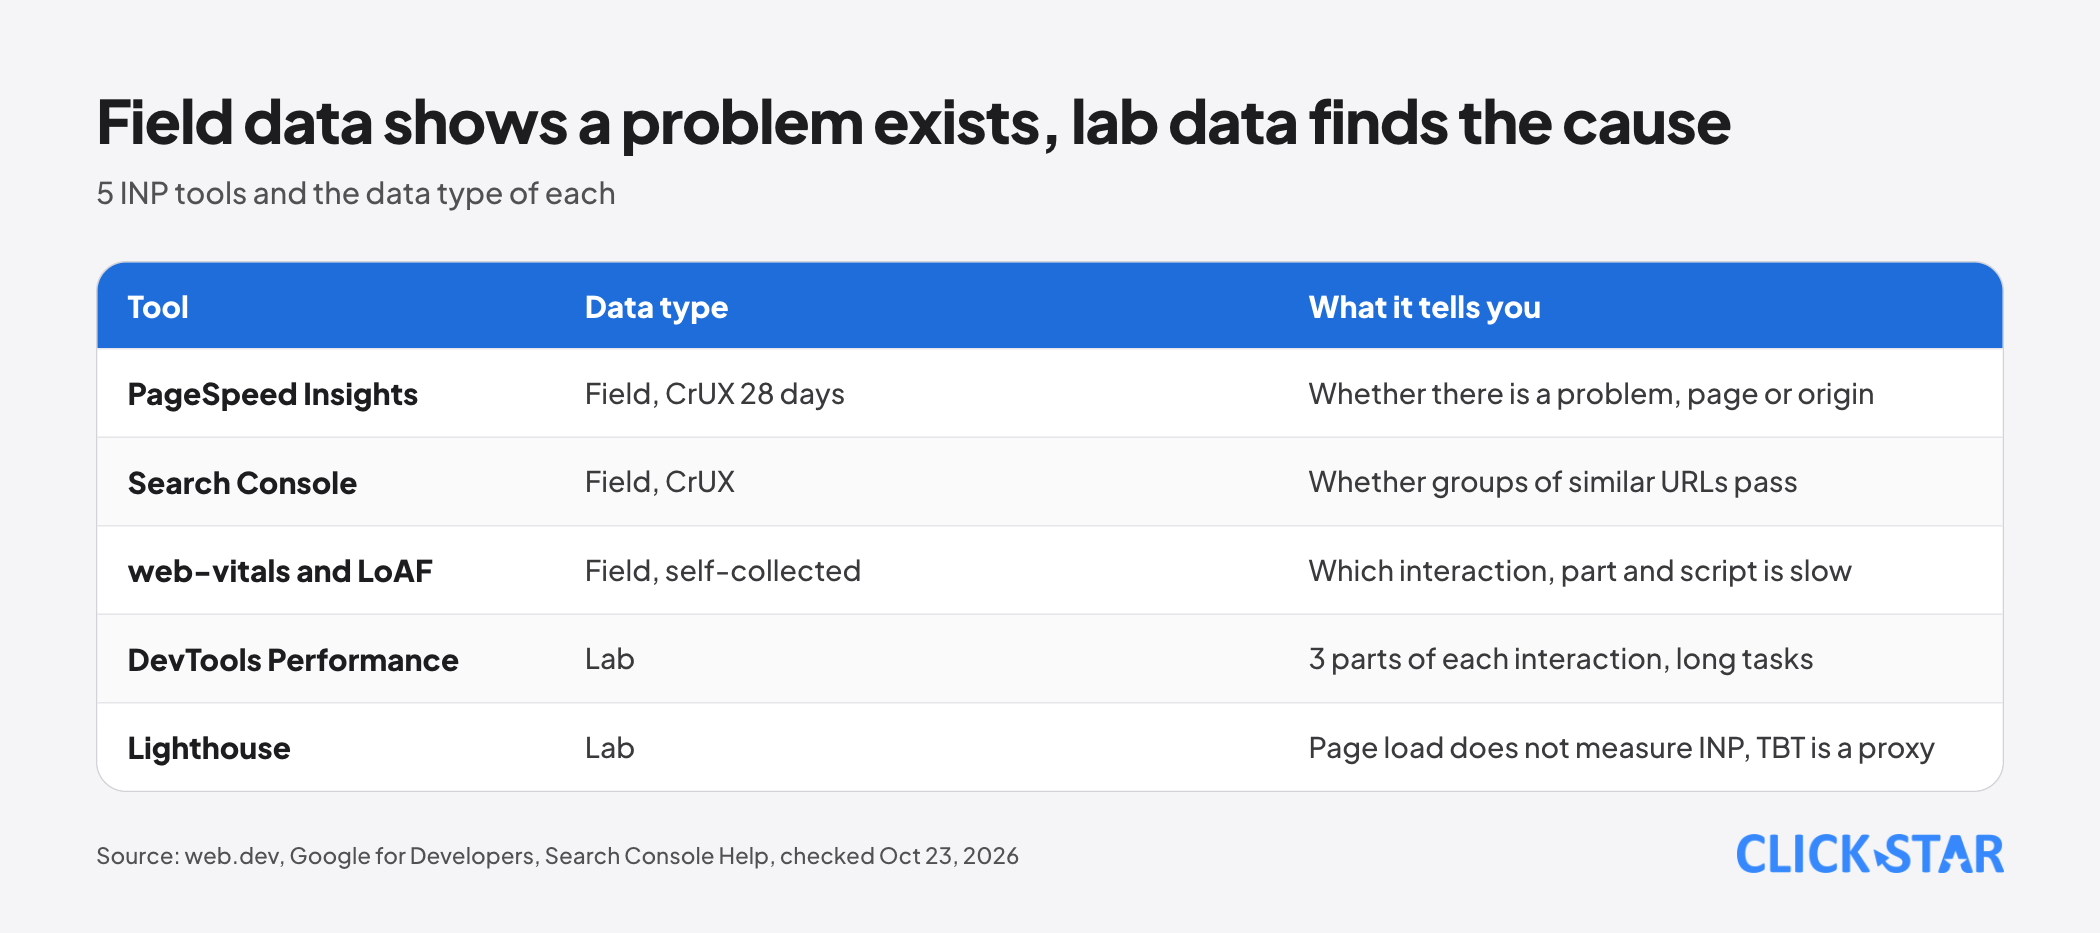
PageSpeed Insights takes field data from the Chrome User Experience Report (CrUX) over the last 28 days, per Google for Developers documentation (updated October 21, 2024). If a page lacks samples, the tool falls back to the whole origin; a page passes when the 75th percentile of all 3 metrics is good (if INP data is missing, LCP and CLS decide).
Per the CrUX methodology page (updated June 20, 2024), a page must be public and sufficiently popular, and data comes only from Chrome on desktop and Android. Chrome on iOS, Android WebView and Edge do not send data, so iPhone visitors are not in these numbers.
The Search Console Core Web Vitals report uses the same CrUX source, groups similar URLs and includes only indexed URLs, as a sample. Its help page says you can break results down by country with BigQuery.
CrUX says there is a problem but not its cause. Web.dev (updated June 7, 2024) recommends the web-vitals library, attribution build, to record the clicked element and the duration of the 3 parts, plus data from the Long Animation Frames API.
That API points to the scripts and functions behind slow frames, but the compatibility table on the Chrome page (updated October 14, 2024) lists only Chrome and Edge from version 123; Firefox and Safari are not supported.
Lab data
The Chrome DevTools Performance panel opens on a live metrics view: as you interact, it records local INP with the 3 parts of each interaction, beside CrUX numbers if set up (documentation updated September 17, 2024).
To find causes, web.dev (updated October 17, 2024) describes recording a trace, performing the interaction and reading the Interactions track, with CPU throttling or a mid-range Android phone, since development machines are faster than visitors' devices.
The Web Vitals Chrome extension is no longer supported as of Chrome 132 (stable on January 7, 2025); its repository points users to the Performance panel.
Lighthouse in page-load mode does not measure INP. Web.dev (updated October 31, 2024) explains that tools running in a simulated environment with no user cannot, and names Total Blocking Time (TBT) as a lab-measurable proxy.
A 2022 Chrome document says Lighthouse's timespan mode measures INP when interactions happen; Click Star has not confirmed this on the current version.
Evidence: how many websites pass INP
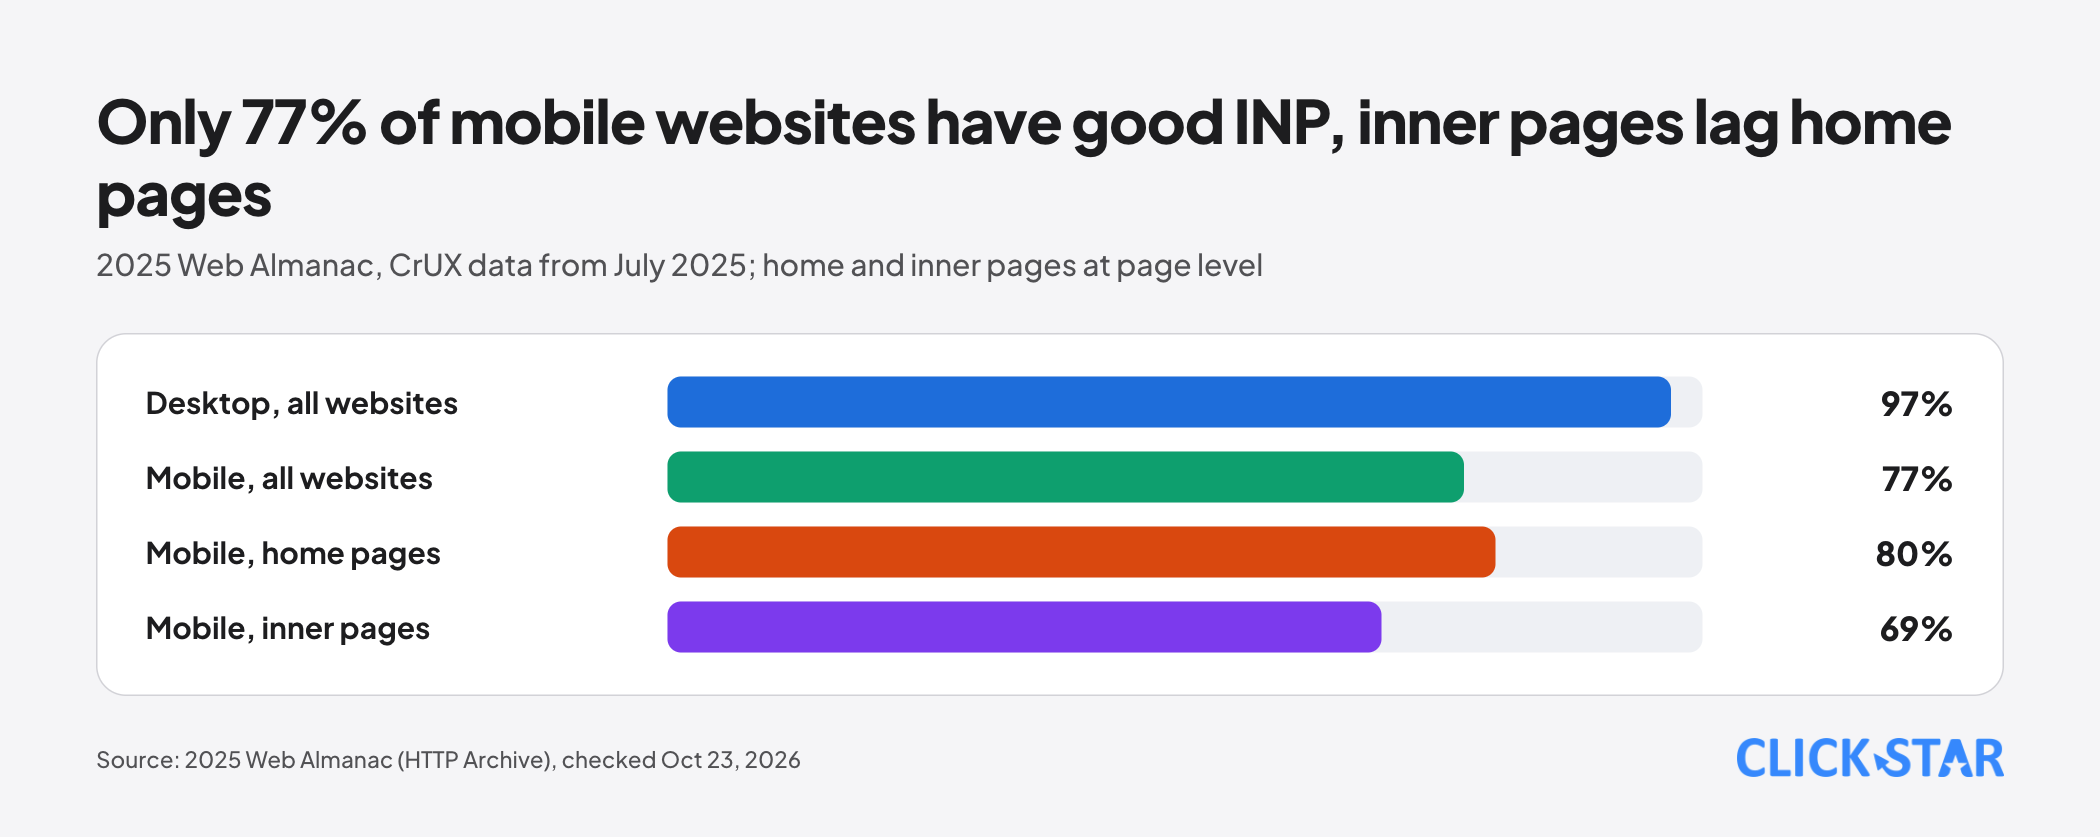
The 2025 Web Almanac by HTTP Archive (Performance chapter, published January 15, 2026) uses CrUX data mainly from July 2025. In this chapter, 97% of websites have good INP on desktop and 77% on mobile (a share of websites, not of visits); mobile is up from 74% in 2024.
At page level (also from CrUX), mobile home pages reach 80% while inner pages reach only 69%. A contrary detail: median mobile TBT rose from 1,209 to 1,916 milliseconds (simulated measurement) while field INP improved. The Almanac treats its possible reasons as hypotheses.
Why interactions are slow: common causes
The general cause is that the browser's main thread does only 1 thing at a time. Per web.dev (updated December 19, 2024), a task running over 50 milliseconds is a long task, and while it runs the browser cannot handle user input.
Scripts loading while the page is open. Web.dev (updated May 9, 2023) explains that each script must be parsed and compiled before it runs, creating long tasks when the page is already visible. A large bundle makes 1 large task; the article suggests about 100 kilobytes per script.
Timers and third-party scripts. Web.dev notes that repeating timers such as setInterval can get in the way of interactions. Third-party scripts (social buttons, ads, measurement, A/B tests) often register their own handlers and timers, which the site owner can hardly control.
Framework hydration. Chrome (Aurora team, updated December 12, 2023) describes hydration as attaching handlers to server-rendered HTML; it can be heavy, and a page can look usable before it is. The team says React's startTransition and Suspense let hydration run in interruptible slices.
Large DOMs and rendering work. When an interaction changes a large DOM, layout and repaint take time. A 2023 web.dev article gives Lighthouse's old thresholds: warning above 800 nodes, excessive above 1,400. Since Lighthouse 13 (October 2025), the Optimize DOM size insight replaces them and fails only on large style or layout work over 40 milliseconds.
How to fix each part of an interaction
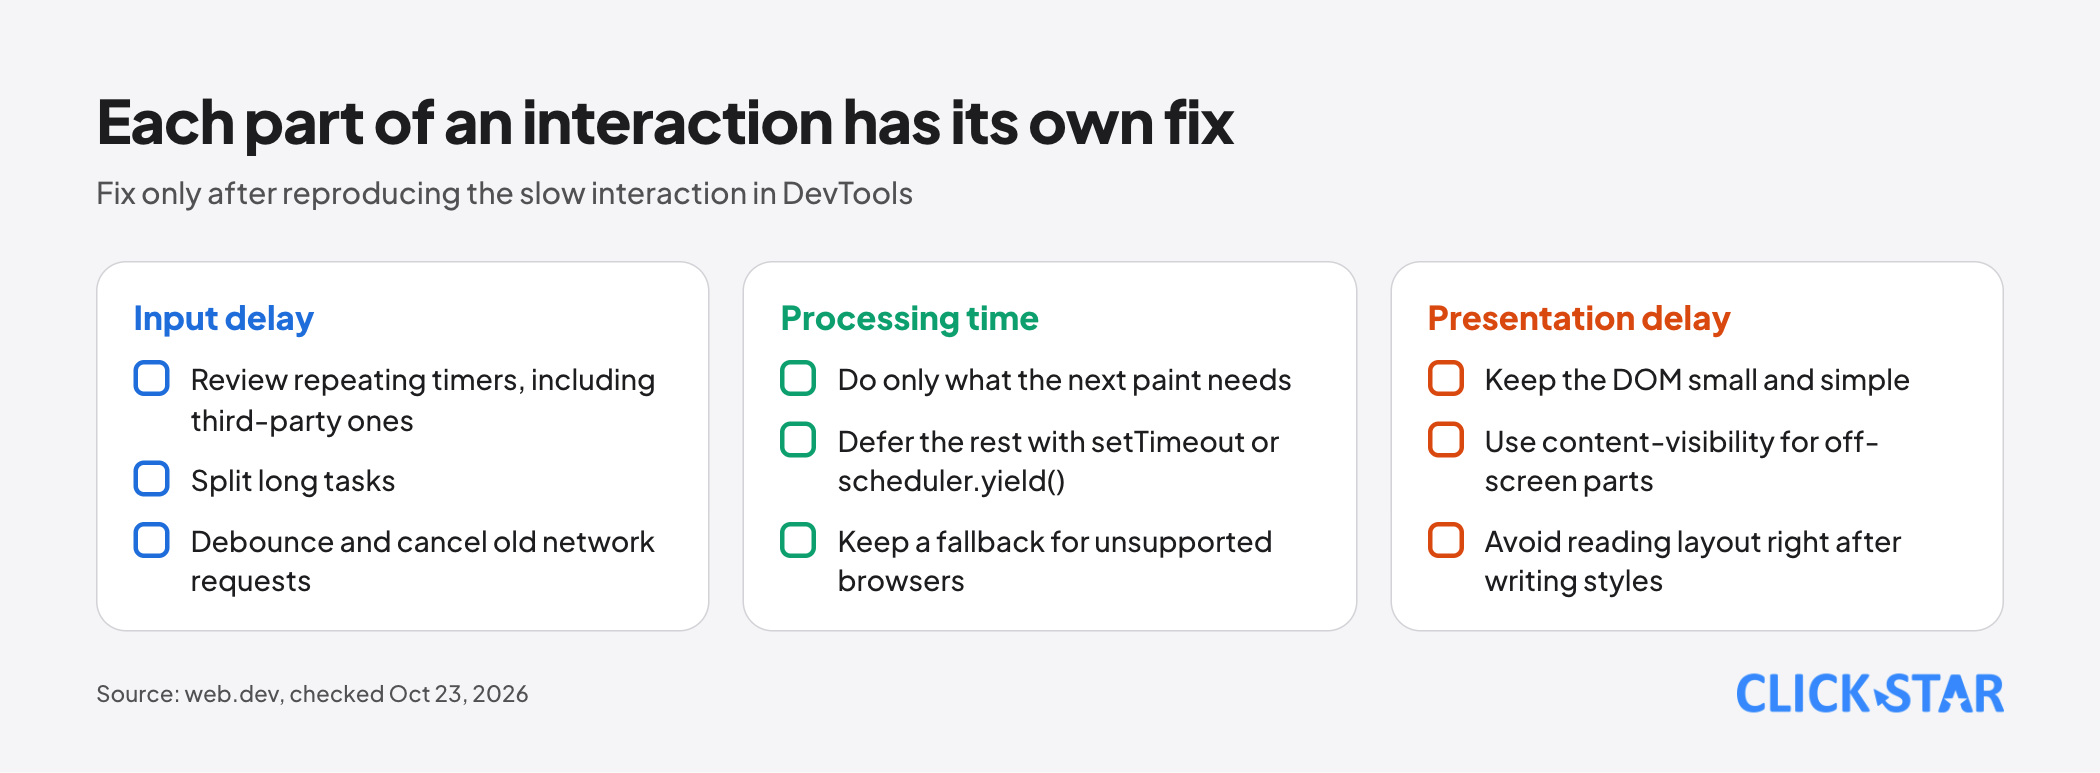
Web.dev's principle: do as little as possible in handlers, split the rest into small tasks, and fix only after reproducing the slow interaction.
Reduce input delay
Review repeating timers, including those in third-party scripts, and split long tasks. For autocomplete search boxes that call the network on every key, web.dev suggests debouncing and using AbortController to cancel old requests.
Reduce processing time
In the handler, do only what is needed to paint the next update and defer the rest. Web.dev (updated September 2, 2025) gives an editor example: update the text box at once, and leave word count, spell check and saving for after the next frame.
There are 2 ways to split tasks. setTimeout runs the rest in a new task but queues it at the back; after 5 nested calls, the browser applies a minimum 5-millisecond wait to each one.
scheduler.yield() runs the rest with higher priority. The compatibility table on web.dev (read October 23, 2026) shows no Safari support, so a setTimeout fallback is needed.
Reduce presentation delay
Keep the DOM small and simple. Use CSS content-visibility so the browser postpones rendering off-screen parts. Avoid reading layout values right after writing styles in the same task.
Third-party scripts
Web.dev (updated February 19, 2024) explains how to find costly scripts with DevTools (group by product in the Bottom-up tab) and how to block requests to test removing each script, then decide whether it is really needed.
For websites on Next.js, the next/script documentation (read October 23, 2026) lists 4 loading strategies, and names lazyOnload as suitable for chat and social widgets.
What this means for Vietnamese businesses
Google says (page experience page, updated September 22, 2026) that its core ranking systems use Core Web Vitals but that there is no standalone page experience signal. Good scores do not guarantee high rankings.
Click Star's view. INP is hard because there is no universal fix. Each website is slow in a different part, so the first job is to find which, not to apply a generic list.
Click Star's inference, not a measurement on Vietnamese websites: the first suspects are chat widgets, tags loaded through Tag Manager, popups, autocomplete search and filters. Every third-party script needs an owner: who added it, why, who removes it.
A 4-week plan (Click Star reference framework)
This framework is Click Star's own proposal, not from outside sources; only the 200-millisecond threshold and the 28-day window come from the sources named.
- Week 1, baseline: run PageSpeed Insights on 5 key pages, mobile and desktop separately, and record INP at the 75th percentile. List 5 key interactions (menu, chat, form, filter, booking).
- Week 2, reproduce: in the Performance panel, enable CPU throttling, perform each interaction, record its 3 parts and mark the slowest part.
- Week 3, change one thing at a time: defer or remove unneeded third-party scripts, split long tasks, reduce the DOM; re-measure after each change.
- Week 4, release and monitor: watch PageSpeed Insights and Search Console. Conclude only after 28 days, comparing with the week 1 baseline and the 200-millisecond threshold.
Common mistakes
- Using the Lighthouse score or TBT as the target instead of field INP at the 75th percentile.
- Testing only on the web team's fast computers, without CPU throttling.
- Testing interactions only after loading, ignoring load time when the main thread is busiest.
- Adding chat widgets, measurement tags and popups without measuring their effect.
- Using setTimeout or scheduler.yield() but leaving heavy work in the handler, or yielding everywhere.
- Concluding right after release, when CrUX field data needs 28 days to reflect the change.
What is not known
Click Star found no INP pass rate specific to Vietnam, and no source among those read that measures a conversion or revenue gain from improving INP. Google does not give the ranking effect of INP as a number.
The reasons the Web Almanac gives for TBT rising while INP improved are only hypotheses. Lighthouse's timespan mode was read only from a 2022 document.
Related posts
Need tailored advice for your business?
Click Star helps you build a solution that fits your industry and scale. We answer every question during business hours.