AI usage statistics by country (2026): who uses it most and where Vietnam stands
A compilation of AI usage figures by country from Microsoft, Eurostat and Ipsos, separated by how they were measured, with Vietnam's position (27.9%, 33rd worldwide in Q2 2026), the 3-period trend and how to read rankings correctly.
When people ask "which country uses AI the most", each source measures something different: individual users, businesses, attitudes, or the volume of conversations with one specific product.
This article gathers the figures with clear methods published up to October 20, 2026, separated by how they were measured so they are not mixed up, and shows where Vietnam stands in each picture.
The main figures come from the Q2 2026 AI Diffusion report of Microsoft's AI Economy Institute (published September 21, 2026), Eurostat's business statistics (2025), the Ipsos AI Monitor 2026 survey and a few supporting sources; any figure taken from press coverage of a report (where the original could not be opened) is marked as such.
Every user figure is an estimate from one provider's data or from a survey, not a census.
Key points
- According to Microsoft, 18.8% of the world's population aged 15 to 64 used a generative AI product in June 2026, up about 1 percentage point from Q1; the developed-economy group (Global North) is at 28.8%, the developing-economy group (Global South) at 16.2%, and the gap is widening.
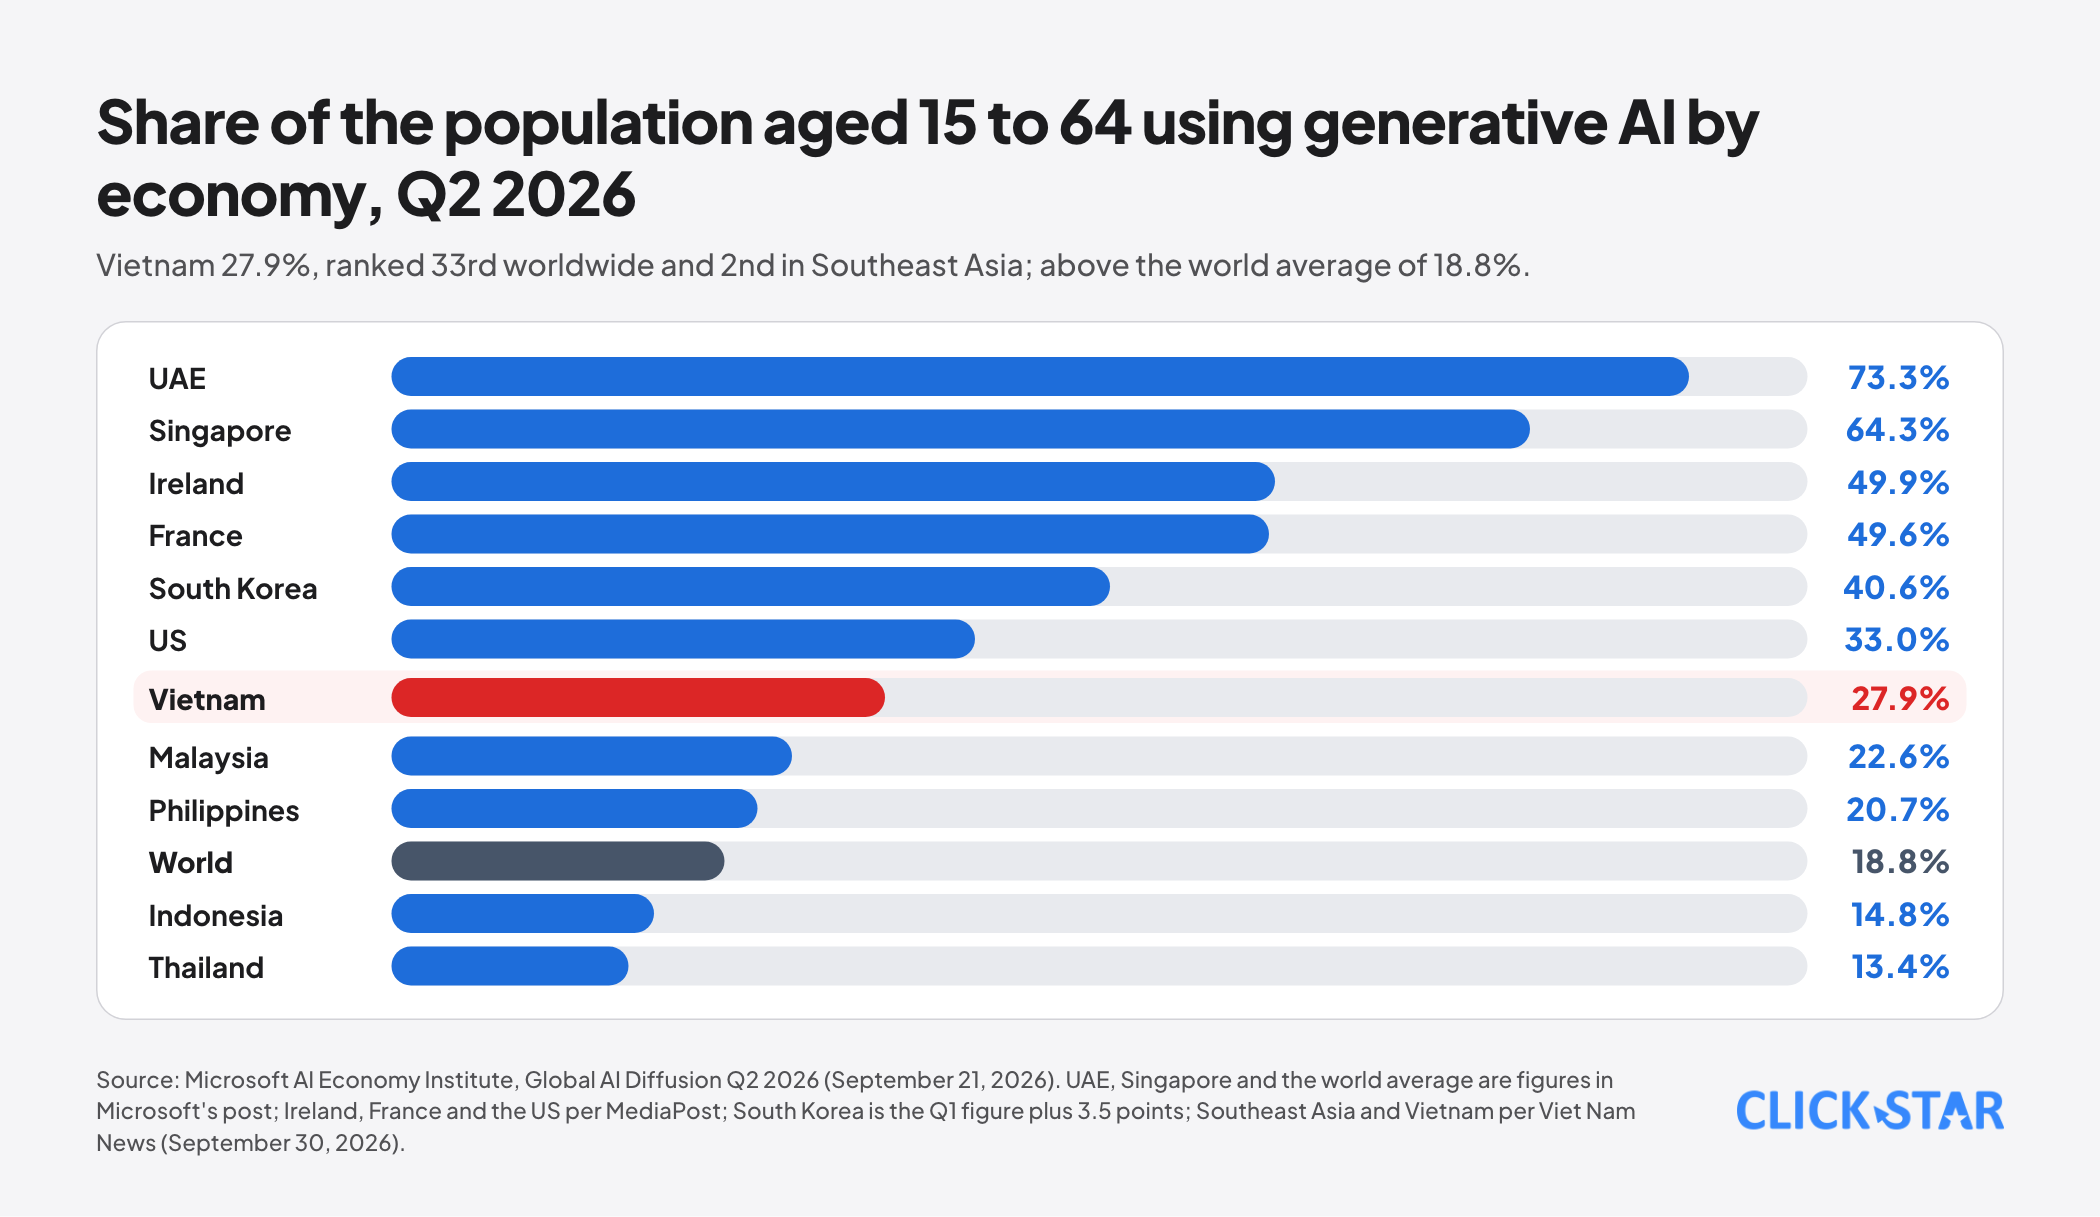
- The leaders are small, highly digital economies: the United Arab Emirates (UAE) at 73.3% and Singapore at 64.3%; per press coverage, Ireland at about 49.9% and France at about 49.6%; South Korea gained 3.5 percentage points, the largest absolute gain of the quarter.
- The US is at about 33.0% and ranks 21st (per coverage), so many smaller economies have a higher share of users: the size of an economy does not decide the user share.
- Vietnam reached 27.9% in Q2 2026, ranking 33rd in the world and 2nd in Southeast Asia behind Singapore (per Vietnamese press coverage of the report), up from 26.5% in Q1 and 23.5% in the second half of 2025 (ranked 38th).
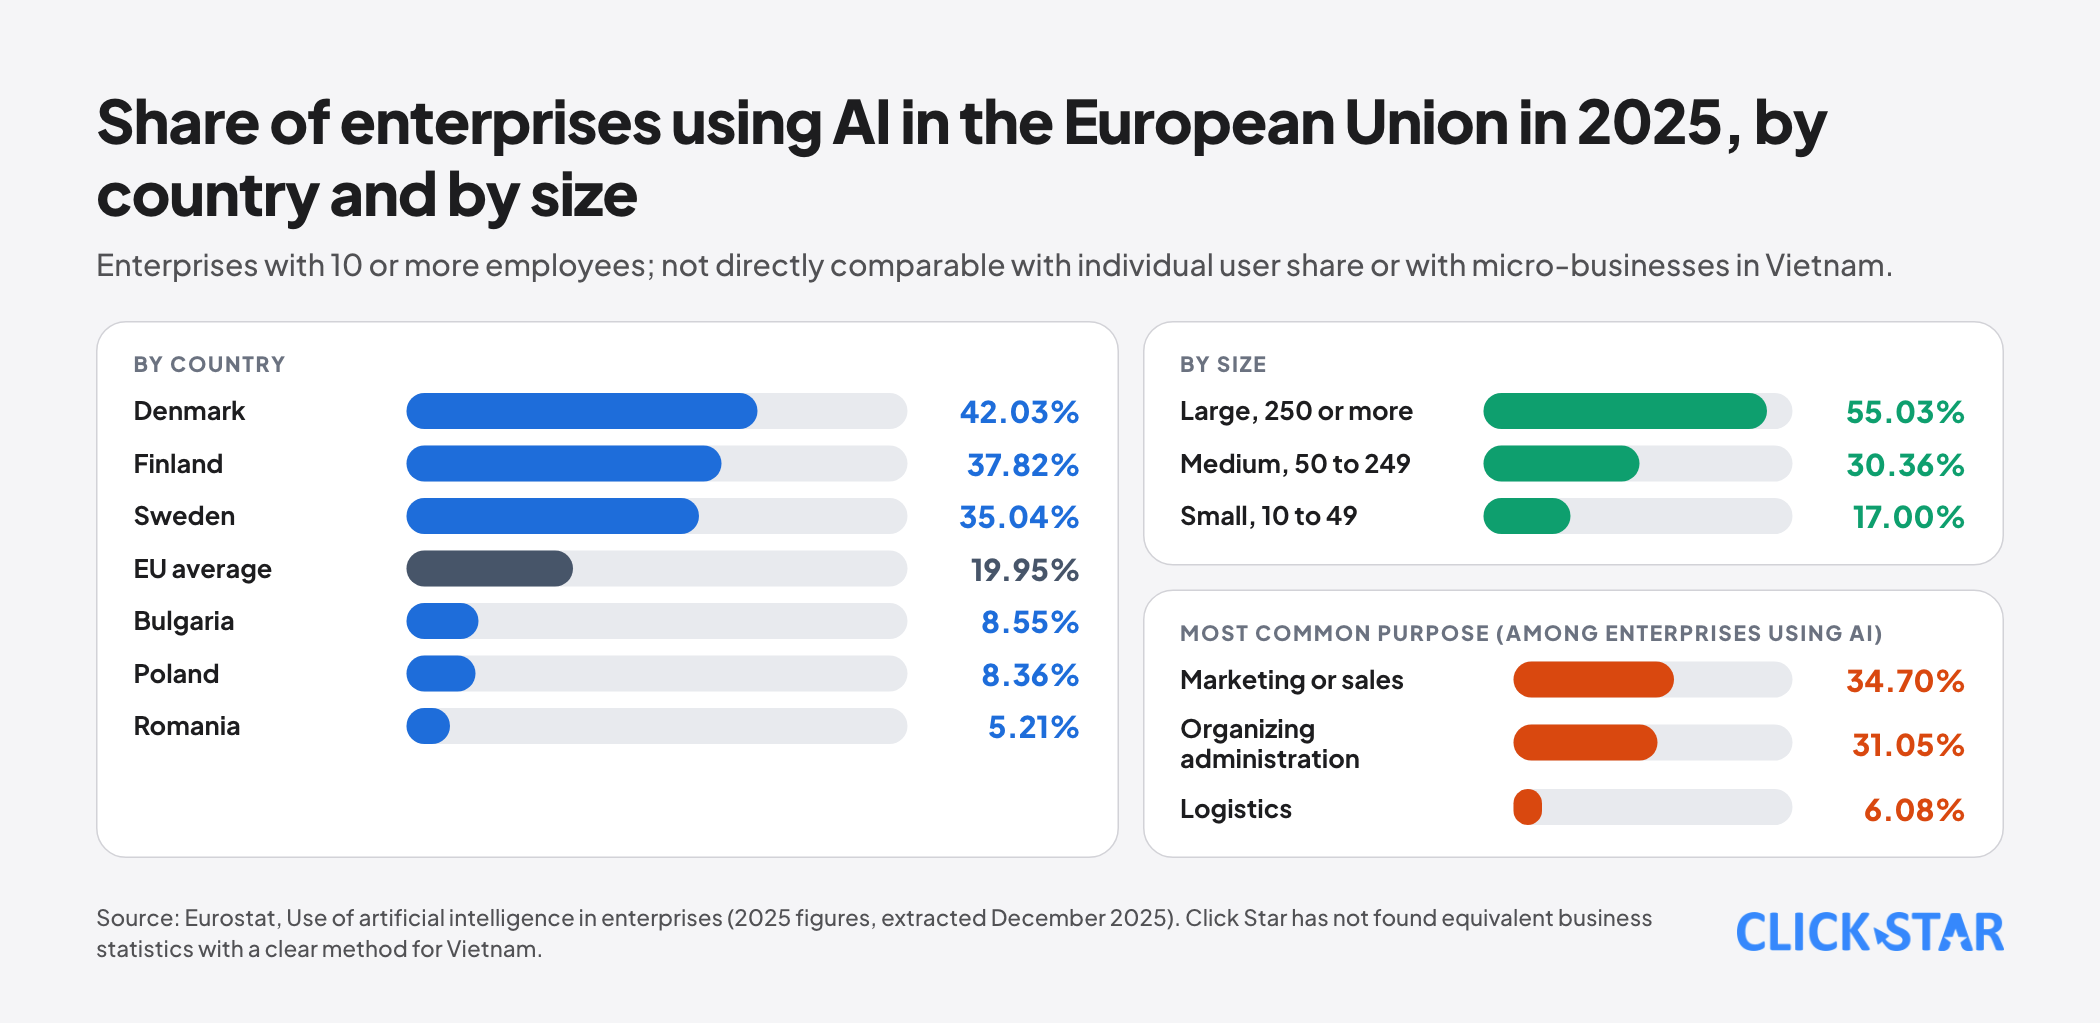
- Businesses are a different picture: according to Eurostat, 19.95% of EU enterprises with 10 or more employees used AI in 2025, from 42.03% in Denmark down to 5.21% in Romania, and 55.03% among large enterprises against about 17% among small ones.
- Attitudes also differ by region: Ipsos AI Monitor 2026 (32 countries) shows people in Asia and Latin America tend to be more optimistic, while people in Europe and North America tend to be more nervous.
Each source measures something different
Before comparing numbers, you need to know what each number measures.
- Microsoft AI Diffusion: the share of people aged 15 to 64 who used a generative AI product in the reporting period, computed from Microsoft's anonymized system data and adjusted for operating system and device share, internet penetration and population size. It is an estimation model, not a survey; Microsoft itself notes that "no single metric is perfect". Microsoft also says the next edition will add newer tools and models, expected to raise the share in almost every economy, with a larger increase in China; meaning China's current figure is affected by the reach of Microsoft products.
- Eurostat: a survey of enterprises with 10 or more employees (and self-employed persons) on using AI technologies such as text mining, computer vision and speech recognition; the 2025 figures come from national surveys in early 2025.
- Ipsos AI Monitor 2026: a survey of self-reported attitudes and experience in 32 countries.
- Reports from model providers: such as the Anthropic Economic Index, which measure the distribution of conversations with one specific product (Claude.ai), not the share of the population using AI.
The Q2 2026 ranking according to Microsoft
The "Global AI Diffusion Q2 2026" report (Microsoft AI Economy Institute, published September 21, 2026, reference month June 2026).
- UAE: 73.3% (Q1: 70.1%; second half of 2025: 64.0%).
- Singapore: 64.3% (Q1: 63.4%; second half of 2025: 60.9%).
- Ireland: 49.9% and France: 49.6% (per MediaPost's coverage of the report; Click Star could not open the full table in the report).
- South Korea: about 40.6%, up 3.5 percentage points, the largest absolute gain; per coverage, ranked 12th (previously 14th).
- US: 33.0%, ranked 21st in both Q1 and Q2 (Q1: 31.3%; second half of 2025: 28.3% and 24th).
- Japan: up 2.2 percentage points from 22.5% in Q1, the largest relative gain.
- Saudi Arabia: up 5 places, from 30th to 25th.
- World: 18.8% (Q1: 17.8%).
A note on sources. UAE, Singapore, South Korea (the gain), Japan, Saudi Arabia and the world average are figures in Microsoft's September 21, 2026 post; the figures for Ireland, France and the US come from press coverage of the report; the South Korea figure of 40.6% is the 3.5-point gain added to the Q1 figure as reported by coverage.
The trend over 3 periods: a widening gap
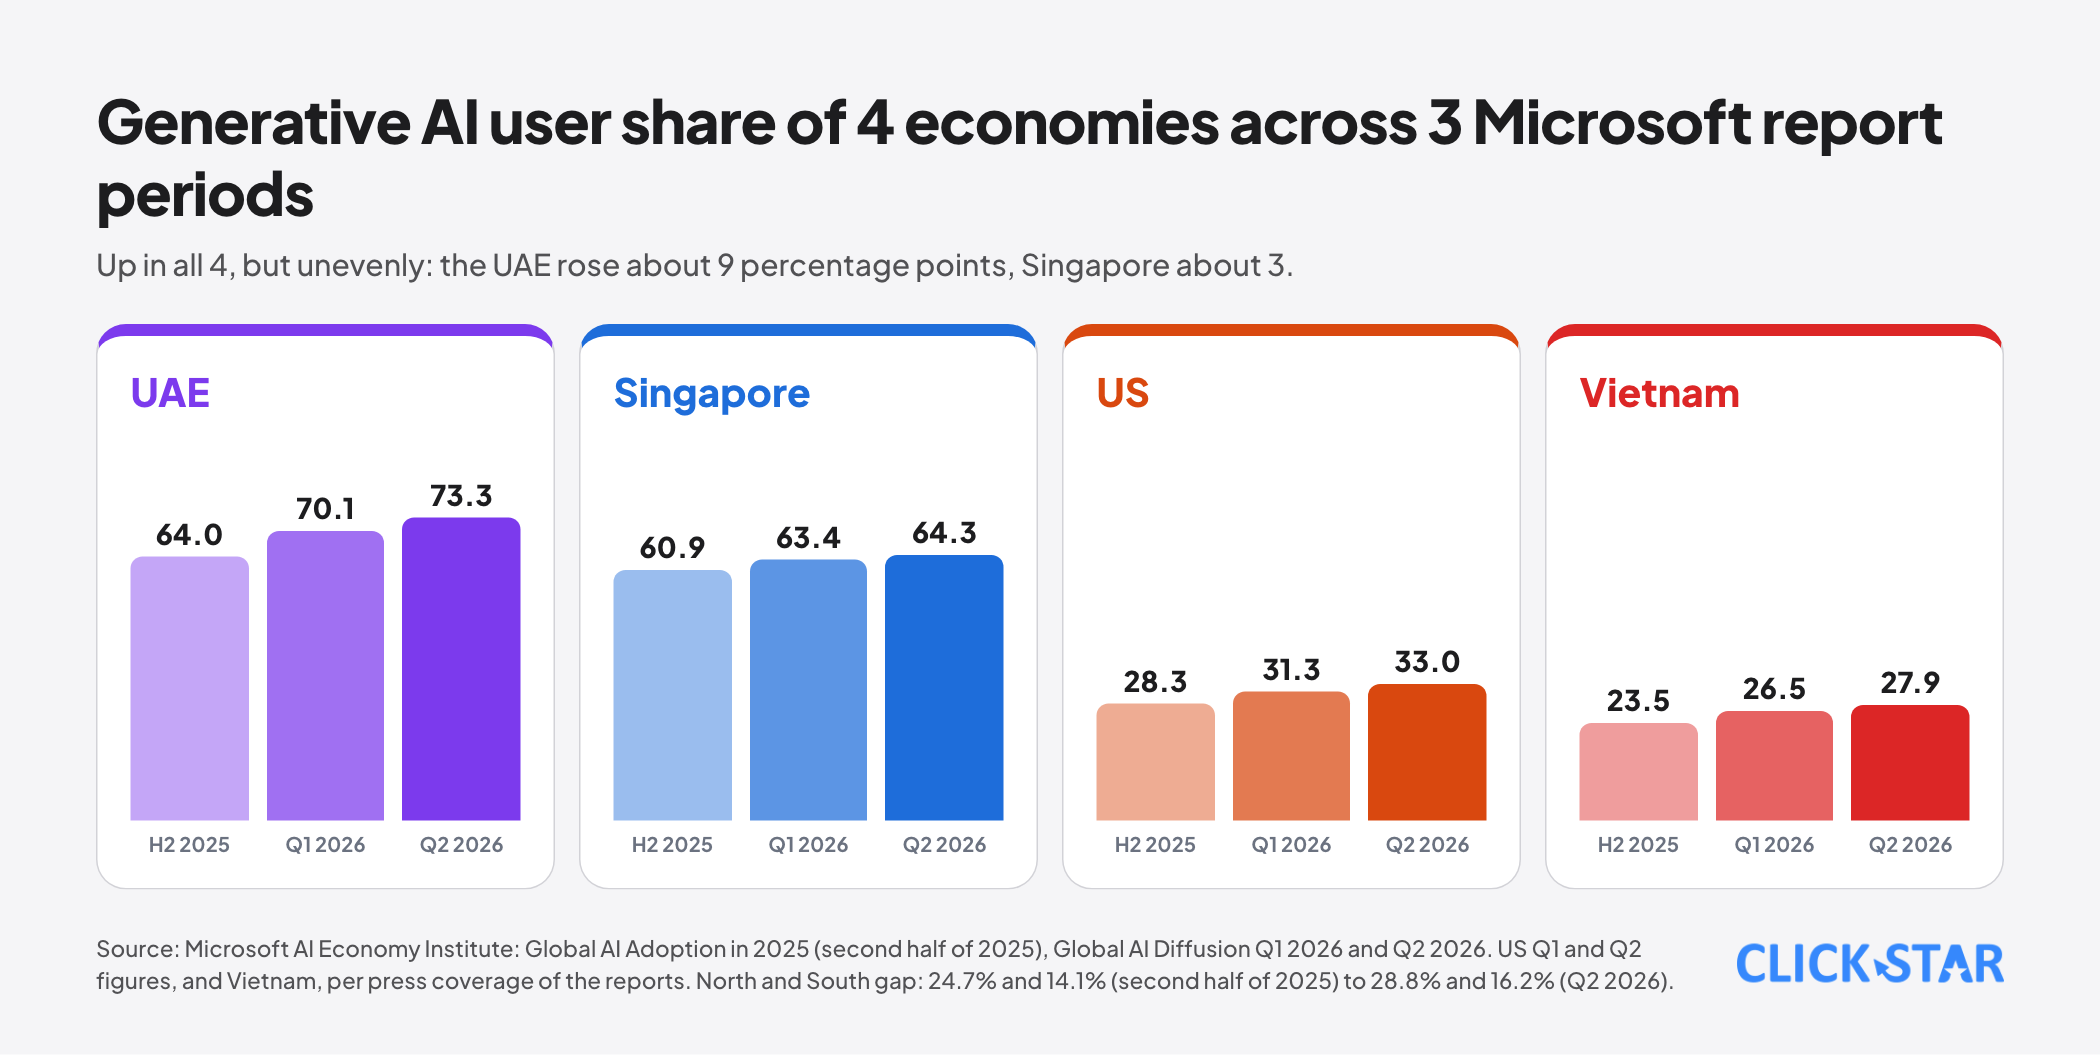
Over 3 periods (second half of 2025, Q1 and Q2 2026), the share rose in almost every economy. The UAE rose from 64.0% to 73.3%; Singapore from 60.9% to 64.3%; the US from 28.3% to 33.0%; Vietnam from 23.5% to 27.9%.
What stands out is that the gains are uneven: the UAE rose about 9 percentage points in 2 periods, while Singapore, already high, rose only about 3 points. Microsoft records the gap between the developed and developing groups widening during the quarter, from 24.7% and 14.1% (second half of 2025) to 28.8% and 16.2% (Q2 2026).
Microsoft also cautions that results by country group reflect early adopters and may change as AI spreads to a wider population.
One detail on usage: Microsoft observes that its consumer Copilot data shows a higher share of education and learning use in the developing group, and that open-weight models take a growing share of API token volume, which may lower costs and support local languages, though infrastructure, connectivity and skills remain barriers.
Where Vietnam stands
According to Vietnamese press coverage of Microsoft's report (Viet Nam News on September 30, 2026), Vietnam reached 27.9% in Q2 2026, ranking 33rd overall and 2nd in Southeast Asia, up 1.4 percentage points from 26.5% in Q1, a gain larger than Malaysia, the Philippines, Indonesia and Thailand.
The regional figures for the same period: Singapore 64.3%, Malaysia 22.6%, the Philippines 20.7%, Indonesia 14.8%, Thailand 13.4%. Against the world average of 18.8% and the developing group at 16.2%, Vietnam is clearly higher, and close to the developed group's 28.8%.
Supporting facts about Vietnam. DataReportal records 85.6 million internet users at the end of 2025 (84.2% of the population).
The e-Conomy SEA 2025 report says 68% of Southeast Asian consumers say AI recommendations influence their purchase decisions and more than US$2.3 billion was invested in more than 680 AI startups in the region in a year (regional figures, Vietnam not broken out).
Google's Southeast Asia Gemini report (July 14, 2026, as cited in Click Star's earlier articles) records 89% of Vietnamese users' prompts written in Vietnamese.
Click Star's view. What stands out most is not the ranking but the structure: Vietnam is well above the developing group's average but still more than 2 times lower than the leaders. That means the user market is large enough for businesses to build products and content for AI, with plenty of room to grow, especially among those who do not yet use it.
Businesses using AI: the picture from Eurostat
Eurostat (2025 figures, extracted December 2025, next update planned December 2026) shows 19.95% of EU enterprises with 10 or more employees using AI technologies, up 6.47 percentage points from 2024 (so about 13.5% in 2024, which Click Star calculated from Eurostat's figure).
Denmark leads (42.03%), then Finland (37.82%) and Sweden (35.04%); the lowest are Romania (5.21%), Poland (8.36%) and Bulgaria (8.55%). By size: 55.03% among large enterprises (250 or more employees), 30.36% among medium ones and about 17% among small ones (10 to 49 employees).
Among enterprises using AI, the most common purposes are marketing or sales (34.70%) and organizing business administration (31.05%); logistics is the lowest (6.08%).
2 things to read with it. The Eurostat figures are for the European Union only and count only enterprises with 10 or more employees, so they cannot be compared directly with Microsoft's individual-user share or with micro-businesses in Vietnam. And Click Star has not found equivalent business statistics with a clear method for Vietnam.
Attitudes: Ipsos AI Monitor 2026
Ipsos's 5th annual survey across 32 countries shows excitement and nervousness about AI have reached near parity globally, and are often felt by the same people. On average 54% say AI products and services have changed their lives in the past 3 to 5 years, and 66% expect AI to affect their daily lives more in the next 3 to 5 years.
Among workers, 62% say AI saved them time in the last 12 months (70% among higher-income, 60% among middle-income and 54% among lower-income respondents; 68% among Gen Z against 46% among baby boomers).
Asia and Latin America are on average more optimistic about benefits and more excited about AI products; Europe and North America are more nervous. In addition, 46% would trust a generative AI tool less if advertisers influenced its answers.
Click Star could not confirm Vietnam is among the survey's 32 countries, so it gives no separate figure for Vietnam.
Why countries differ
Click Star names 5 groups of factors; this is Click Star's judgment based on the sources above, not any source's causal conclusion.
- Infrastructure and digitization: small, highly digital, well-connected economies (UAE, Singapore, Ireland) lead; Microsoft notes the US has many users in absolute terms but a lower share than smaller, highly digital countries.
- Income: press summaries of the Anthropic Economic Index (September 2025, original not opened) say 1% higher GDP per capita goes with about 0.7% higher usage, and countries such as Israel, Singapore, Australia, New Zealand and South Korea rank highest on per-capita usage; this measures conversations with one specific product, not the share of the population.
- Language: support for local languages determines ease of use; for Vietnam, 89% of prompts in Vietnamese shows users are used to typing in their mother tongue.
- Policy and trust: the legal framework and social attitudes (Ipsos shows regional differences).
- How it is measured: one provider's system data is affected by that provider's product reach in each country.
How to read the rankings correctly
- Do not compare individual user share (Microsoft) with business share (Eurostat) or attitudes (Ipsos).
- "Has used" differs from "uses regularly" or "uses effectively"; the sources above do not measure quality of use.
- Small gaps between countries close together in a ranking often sit within the model's margin of error.
- Rankings change by quarter and with method changes; Microsoft has warned the next edition will add new tools.
- European business figures are not Vietnam's figures; the lack of an equivalent measurement does not mean the share is low or high.
What it means for businesses in Vietnam and what to do
- For businesses selling to end users: put AI into your customers' search and advice channels (content good enough to be cited, clear product data); Click Star has articles on user search trends and the shift in SEO in the AI era.
- For businesses using AI themselves: against the European picture, marketing and sales is the most common purpose (34.70% of AI-using enterprises); start from work with a clear measure (time to draft content, customer response time) and a human reviewer.
- Measure usage inside your own business: an internal 5-question survey (who uses it, for what, how often, how many hours saved, any errors) gives more useful information than any national ranking.
- Train by group: according to Ipsos, time savings differ by generation and income; design training for the groups that use it less rather than for those already used to it.
- Compliance: more use means more data risk; Click Star has articles on the personal data protection law and on 7 skills for using AI.
Metrics to track
- The share of employees using AI at least weekly (internal survey).
- Average hours saved per person per week and how it is measured.
- The share of AI-assisted work that goes through a human review step.
- The share of your end users who search or ask through AI assistants (customer survey).
- Vietnam's Microsoft AI Diffusion figure each quarter and Eurostat's figure each year as benchmarks.
Common mistakes
- Mixing different measures (users, businesses, attitudes) into one ranking.
- Treating rank as a quality score, when the sources only measure reach.
- Using one quarter's figure or a coverage article's figure without checking the original report.
- Using European business figures in place of Vietnam's.
- Concluding "Vietnam is not ready" or "already more than ready" from one rank.
- Not measuring usage and results inside your own business.
- Ignoring that figures change by quarter and by method.
Related posts
Need tailored advice for your business?
Click Star helps you build a solution that fits your industry and scale. We answer every question during business hours.