How website speed affects revenue: measuring and improving Core Web Vitals
Published evidence on speed and revenue with the limits of each study, the 3 Core Web Vitals metrics and thresholds, how to measure with field data and a fix list per metric, based on web.dev, Google Search Central and the Web Almanac 2025.
Many people believe a slow website loses customers, but few know how many, how to measure it, and what to fix first. Most of the "1 second slower loses 7% of revenue" figures circulating online have no clear source, or come from old vendor studies.
This article presents the published evidence on speed and revenue with the limits of each study, the 3 Core Web Vitals metrics and their thresholds, how to measure correctly with field data, and a fix list per metric. The main sources are web.dev, Google Search Central documentation, the HTTP Archive Web Almanac 2025, Next.js documentation and Google's case studies, read on October 21, 2026.
Click Star already has articles on what a converting website looks like and on SEO thinking. This one goes into speed and Core Web Vitals. It needs saying plainly: every case study below was published by Google, written with the advertiser, selected from successes and mostly about large brands.
Key points
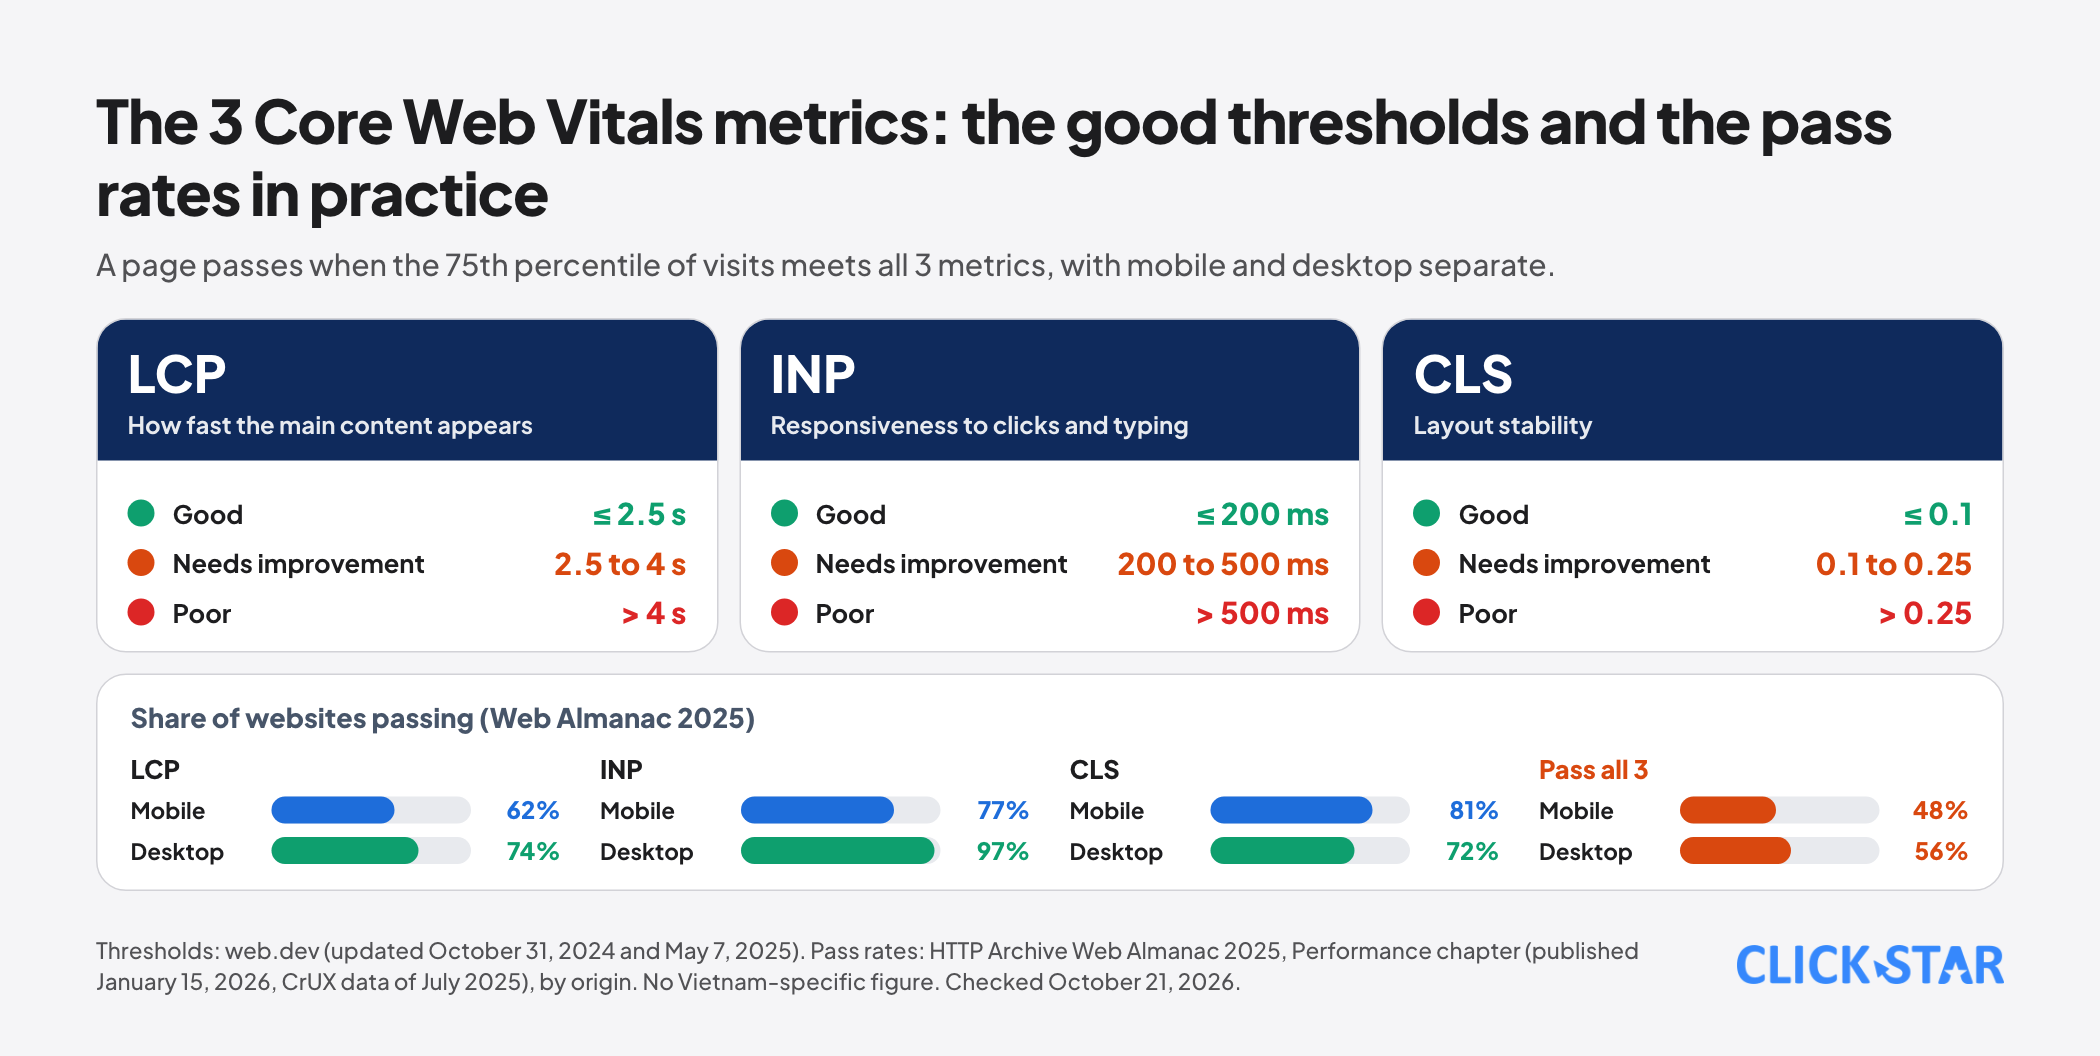
- Core Web Vitals has 3 metrics. LCP (how fast the main content appears) is good at no more than 2.5 seconds, INP (responsiveness to clicks) is good at no more than 200 milliseconds, and CLS (layout stability) is good at no more than 0.1. A page passes when the 75th percentile of visits meets all 3.
- INP replaced FID as an official metric on March 12, 2024, and the 3 metrics and thresholds have not changed since. Click Star found no Google source for the "2026 changes" some blogs cite.
- Evidence on revenue: Deloitte's study for Google (2020) recorded that a 0.1-second improvement went with 8.4% higher retail conversion, but it is observational, not an experiment. Only Vodafone and Rakuten 24 were controlled tests.
- Google says page experience is not a single signal, and that CWV does not guarantee ranking. The business case should rest on customer behavior, not on ranking.
- According to the Web Almanac 2025, only 48% of websites on mobile pass all 3 metrics (56% on desktop), and LCP on mobile is the weakest (62%).
- Measure with field data (CrUX over 28 days, 75th percentile), use lab data for debugging, and fix LCP first.
What Core Web Vitals are
According to web.dev (updated October 31, 2024), Core Web Vitals has 3 metrics. LCP (Largest Contentful Paint) measures the time for the largest piece of content to appear, good at no more than 2.5 seconds. INP (Interaction to Next Paint) measures the delay when a user clicks or types, good at no more than 200 milliseconds. CLS (Cumulative Layout Shift) measures unexpected layout movement, good at no more than 0.1.
The poor thresholds are LCP over 4 seconds, INP over 500 milliseconds and CLS over 0.25; between them is needs improvement (web.dev, May 7, 2025). The thresholds are the same for mobile and desktop but were set mainly by what mobile can achieve. A page passes when the 75th percentile of page loads meets all 3 metrics, with mobile and desktop segmented separately.
The 75th percentile means 3 in 4 visits meet the threshold. web.dev says this balances most visits reaching the target against outliers not skewing the result.
INP replaced FID as an official metric on March 12, 2024. The latest CrUX release notes (October 13, 2026) only add experimental variants of LCP, INP and CLS that include navigations within single-page apps (SPAs). Click Star found no Google source for blog posts saying 2026 brought a change in calculation or a higher ranking weight.
How speed affects revenue
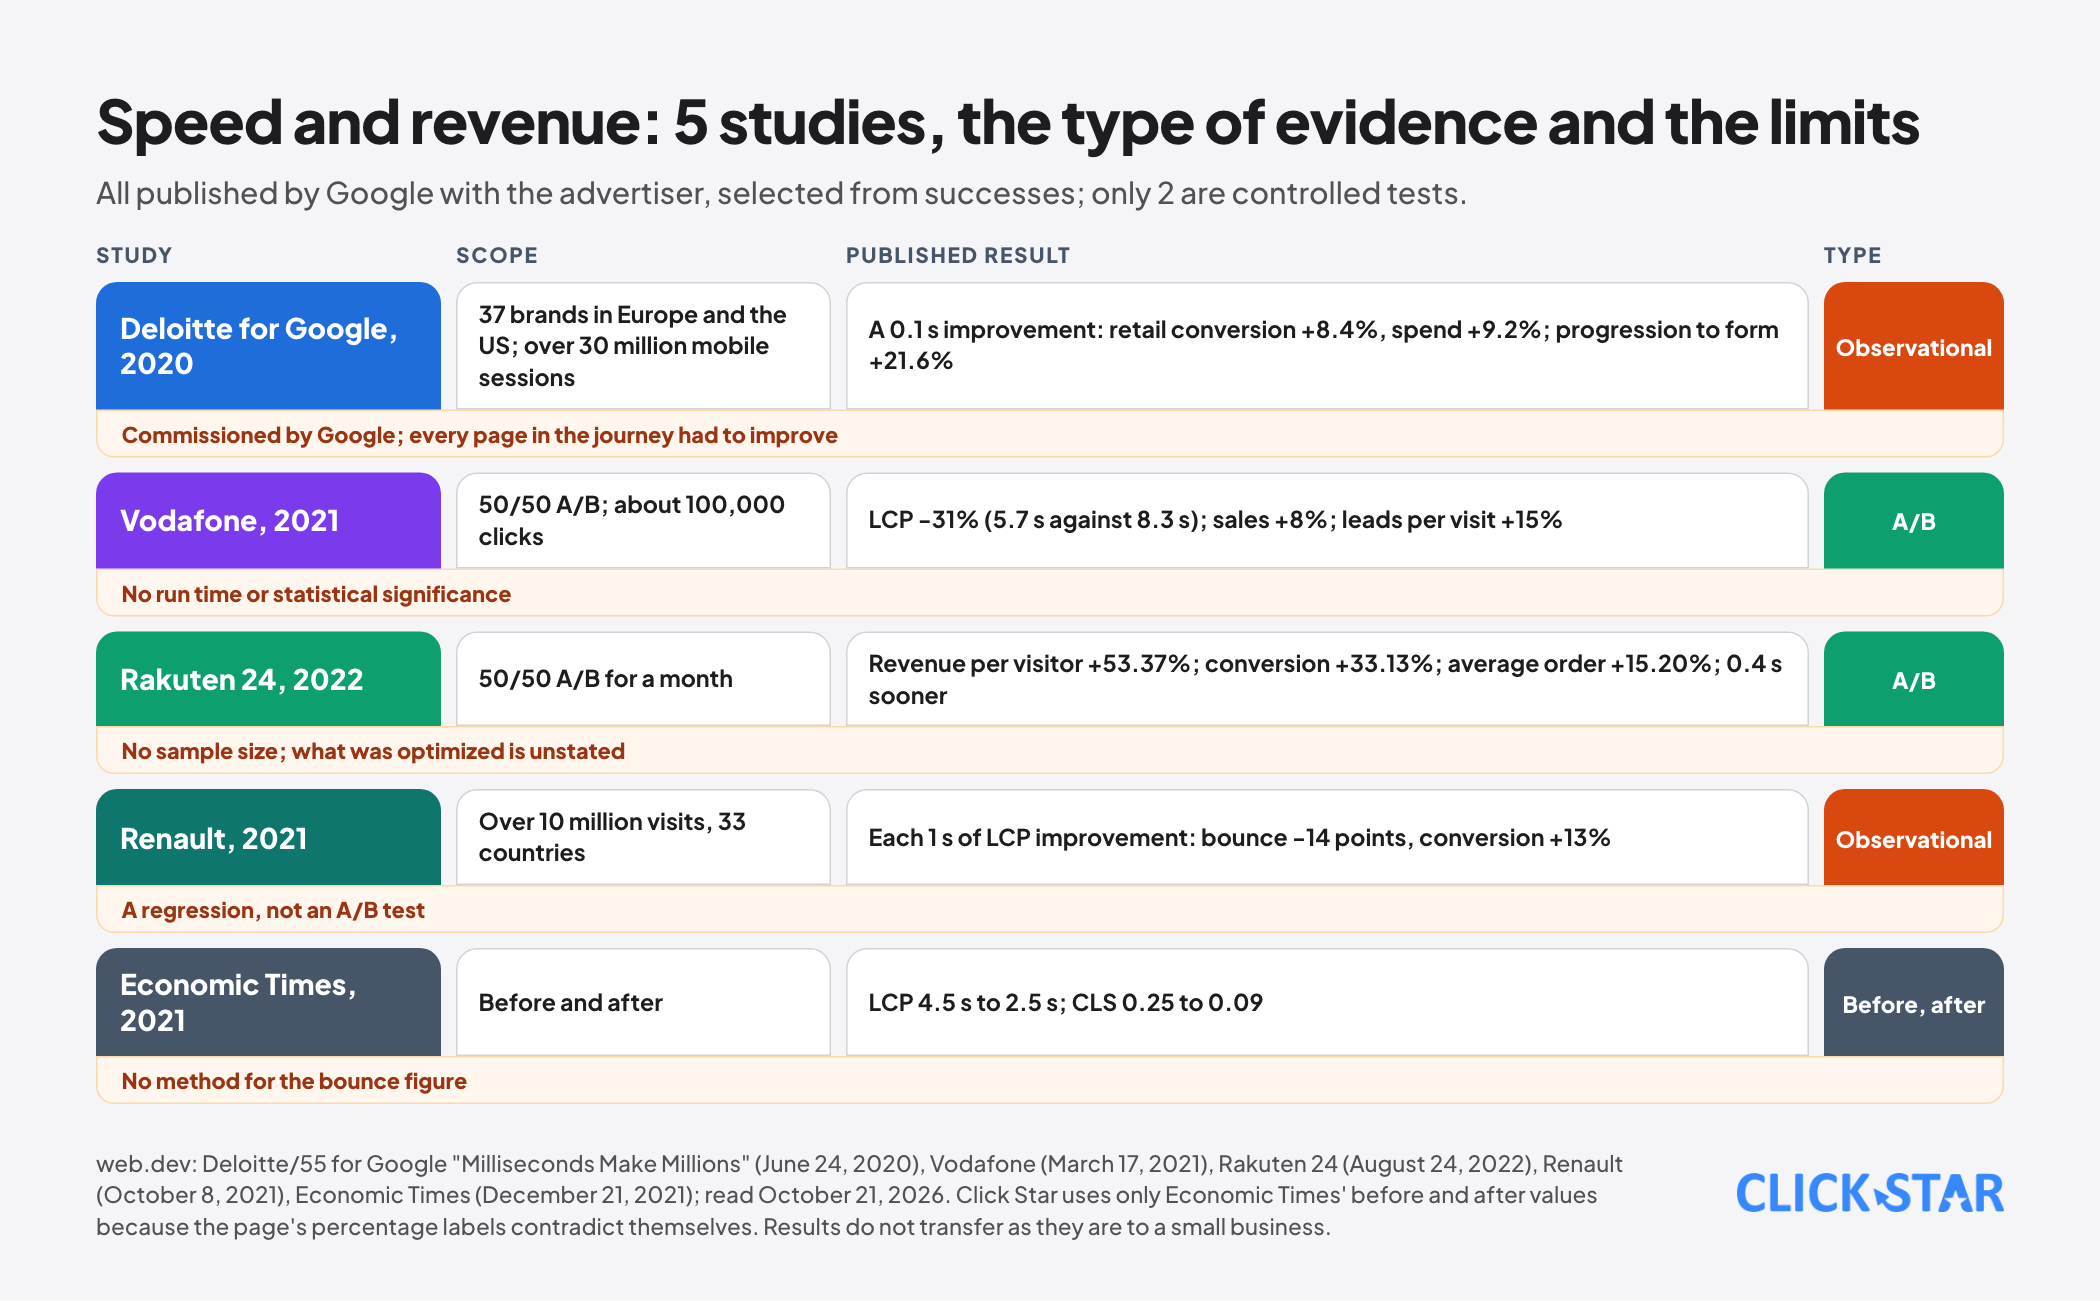
Deloitte for Google, "Milliseconds Make Millions" (web.dev, June 24, 2020). The study tracked 37 brands in Europe and the US with more than 30 million mobile sessions over the last 30 days of 2019, with no interface redesigns.
A 0.1-second improvement across 4 metrics went with: retail conversion 8.4% higher and spend 9.2% higher; travel bookings 10% higher; lead generation progression to form submission 21.6% higher.
Limits: this is observation (correlation), not an A/B test, commissioned by Google. The effects appeared only when every page in the journey improved, and the speed metrics used are now partly outdated.
Vodafone (web.dev, March 17, 2021). A 50/50 A/B test on an ad landing page, about 100,000 clicks. Field LCP improved 31% (5.7 seconds against 8.3 seconds), sales rose 8%, the lead-to-visit rate rose 15% and the cart-to-visit rate rose 11%. The changes included server-side rendering, less render-blocking JavaScript and image optimization.
Limits: it states no run time, statistical significance or absolute figures, and another metric (DCL) got worse. This is a case study written by Vodafone itself.
Rakuten 24 (web.dev, August 24, 2022). A one-month 50/50 A/B test where the only difference was the CWV optimization. Revenue per visitor rose 53.37%, conversion rose 33.13%, average order value rose 15.20% and exit rate fell 35.12%, with the optimized page loading 0.4 seconds sooner (1.6 seconds against 2 seconds).
Limits: the page does not say what exactly was optimized, and gives no sample size or statistical significance.
Renault (web.dev, October 8, 2021). Across more than 10 million visits in 33 countries, each 1 second of LCP improvement went with a 14-point lower bounce rate and 13% higher conversion; the share of visitors with LCP under 2.5 seconds rose from 51% to 73% in the 5 largest markets. This is not an A/B test but a regression on observational data, so it shows only correlation.
Economic Times (web.dev, December 21, 2021). Field LCP fell from 4.5 seconds to 2.5 seconds and CLS from 0.25 to 0.09; the page cites a "43% better bounce rate" but gives no method and contradicts itself on a few percentage labels. Click Star uses only the before and after values.
Click Star's view. All 5 are case studies published by Google with the advertiser, selected from successes and mostly about large brands. Only 2 of them are controlled tests. Results do not transfer as they are to a small business, but the general direction is consistent: a faster page tends to go with higher conversion.
Click Star does not use the figure "53% of visitors leave if a page takes over 3 seconds" because its 2016 origin could not be read on a live Google page.
Does speed help search ranking
According to a Google Search Central page (December 10, 2025), Core Web Vitals aligns with what the core ranking systems seek to reward, and Google strongly recommends achieving good CWV. The page gives no weight.
The page on page experience (September 22, 2026) says there is no single signal for page experience, and that Google always prefers relevant content even when page experience is poor. A good experience can help when many helpful pages compete, and CWV scores from tools do not guarantee a high ranking. Click Star read these pages through a summarizing tool, so the wording should be checked on the original pages.
Click Star's safe reading: treat CWV as a secondary ranking factor, like a tiebreaker between 2 similar pages. The reason to invest in speed should rest on customer behavior, as in the studies above, not on ranking.
How to measure correctly
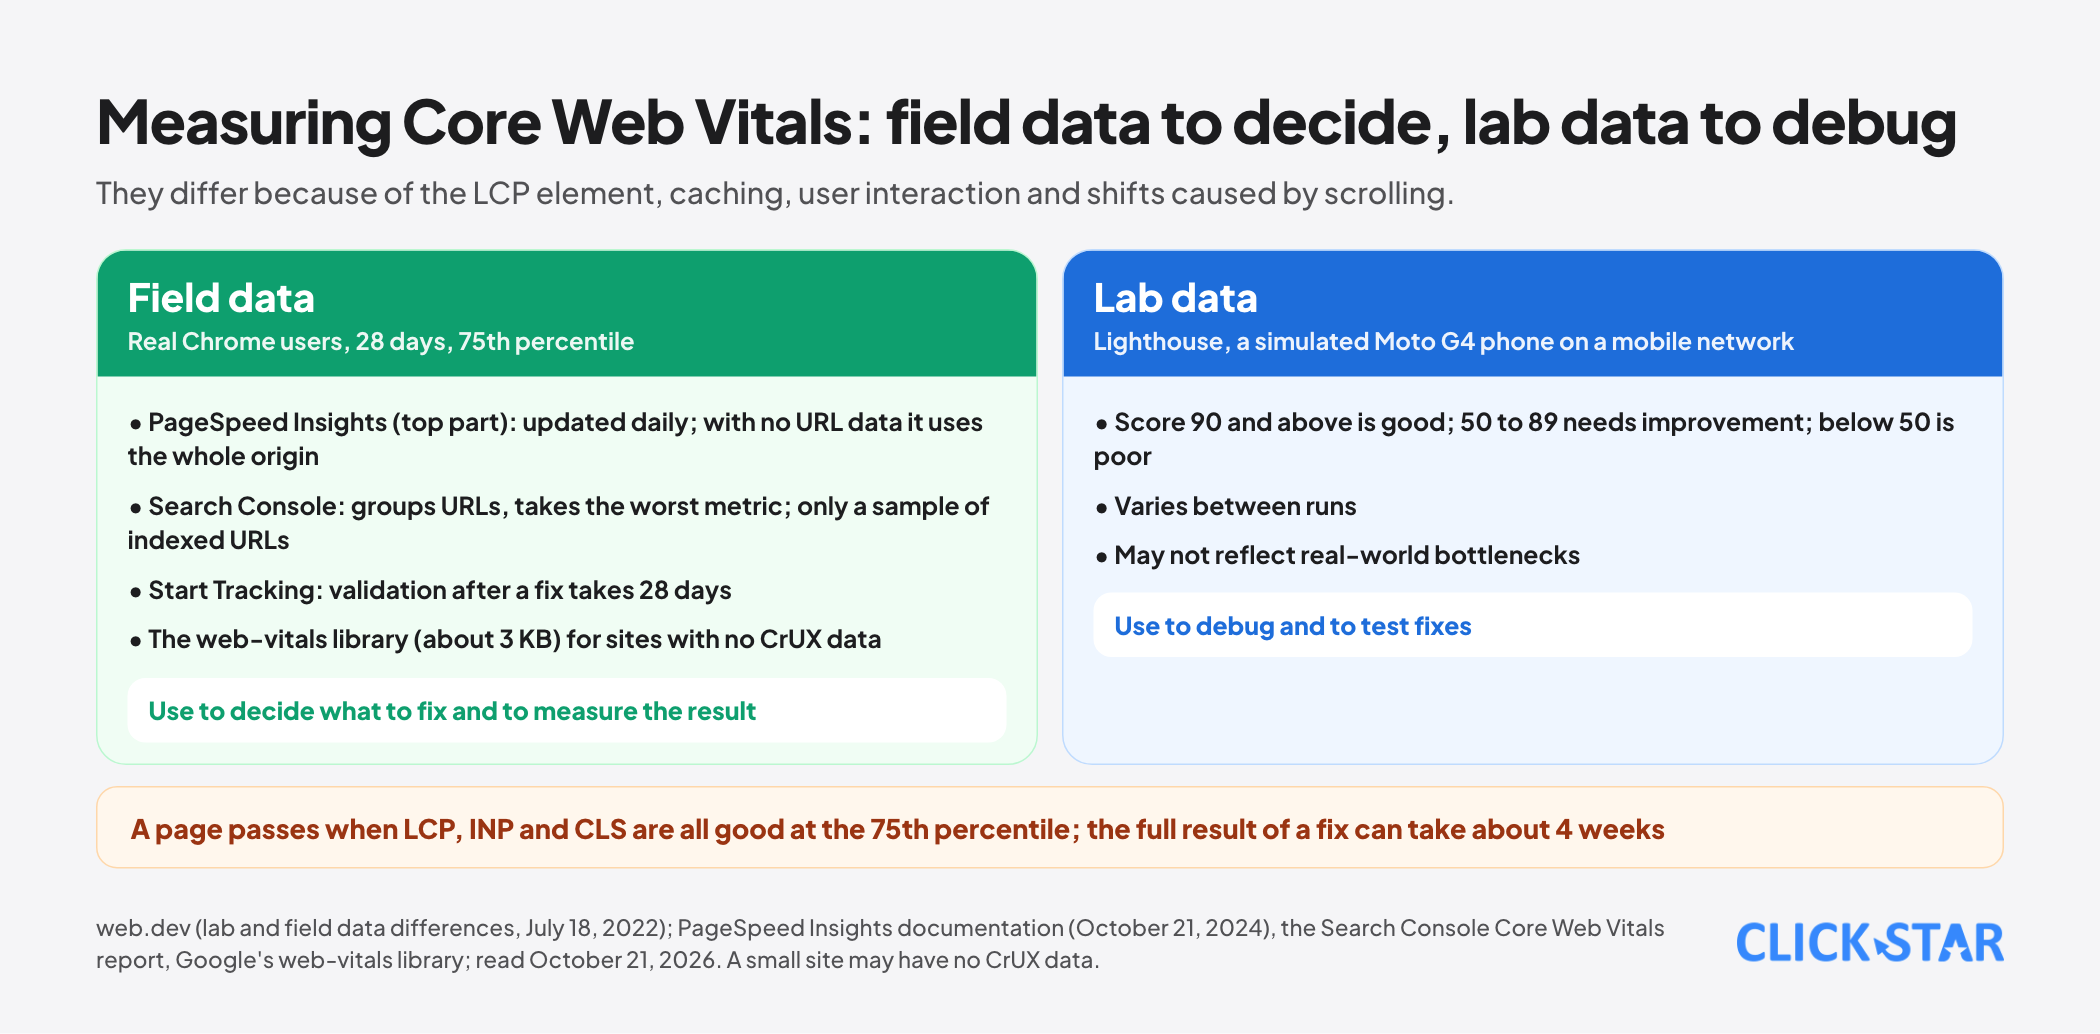
Field data and lab data. According to web.dev, prioritize field data (from real users) to decide what to fix, and use lab data to debug. The 2 differ because of the LCP element, caching, user interaction (for INP) and shifts caused by scrolling.
PageSpeed Insights. The field part comes from CrUX (real Chrome user data) for the last 28 days, at the 75th percentile, updated daily. If a URL lacks data, the tool uses data for the whole origin. A page passes when LCP, INP and CLS are all good.
The lab part is run by Lighthouse (a simulated Moto G4 phone on a mobile network): 90 and above is good, 50 to 89 needs improvement, below 50 is poor. The score varies between runs and may not reflect real-world bottlenecks.
Search Console. The Core Web Vitals report uses CrUX over 28 days, separates mobile and desktop, groups URLs and takes the worst metric status of the group. The report includes only a sample of indexed URLs and suits seeing site-wide patterns. The "Start Tracking" feature runs a 28-day validation after a fix, so the full result can take up to about 4 weeks.
A small site may have no CrUX data. In that case use Google's web-vitals library (about 3 KB) to measure on real users, with onLCP, onINP and onCLS; the attribution build shows the LCP element and the CLS target.
Improving each metric
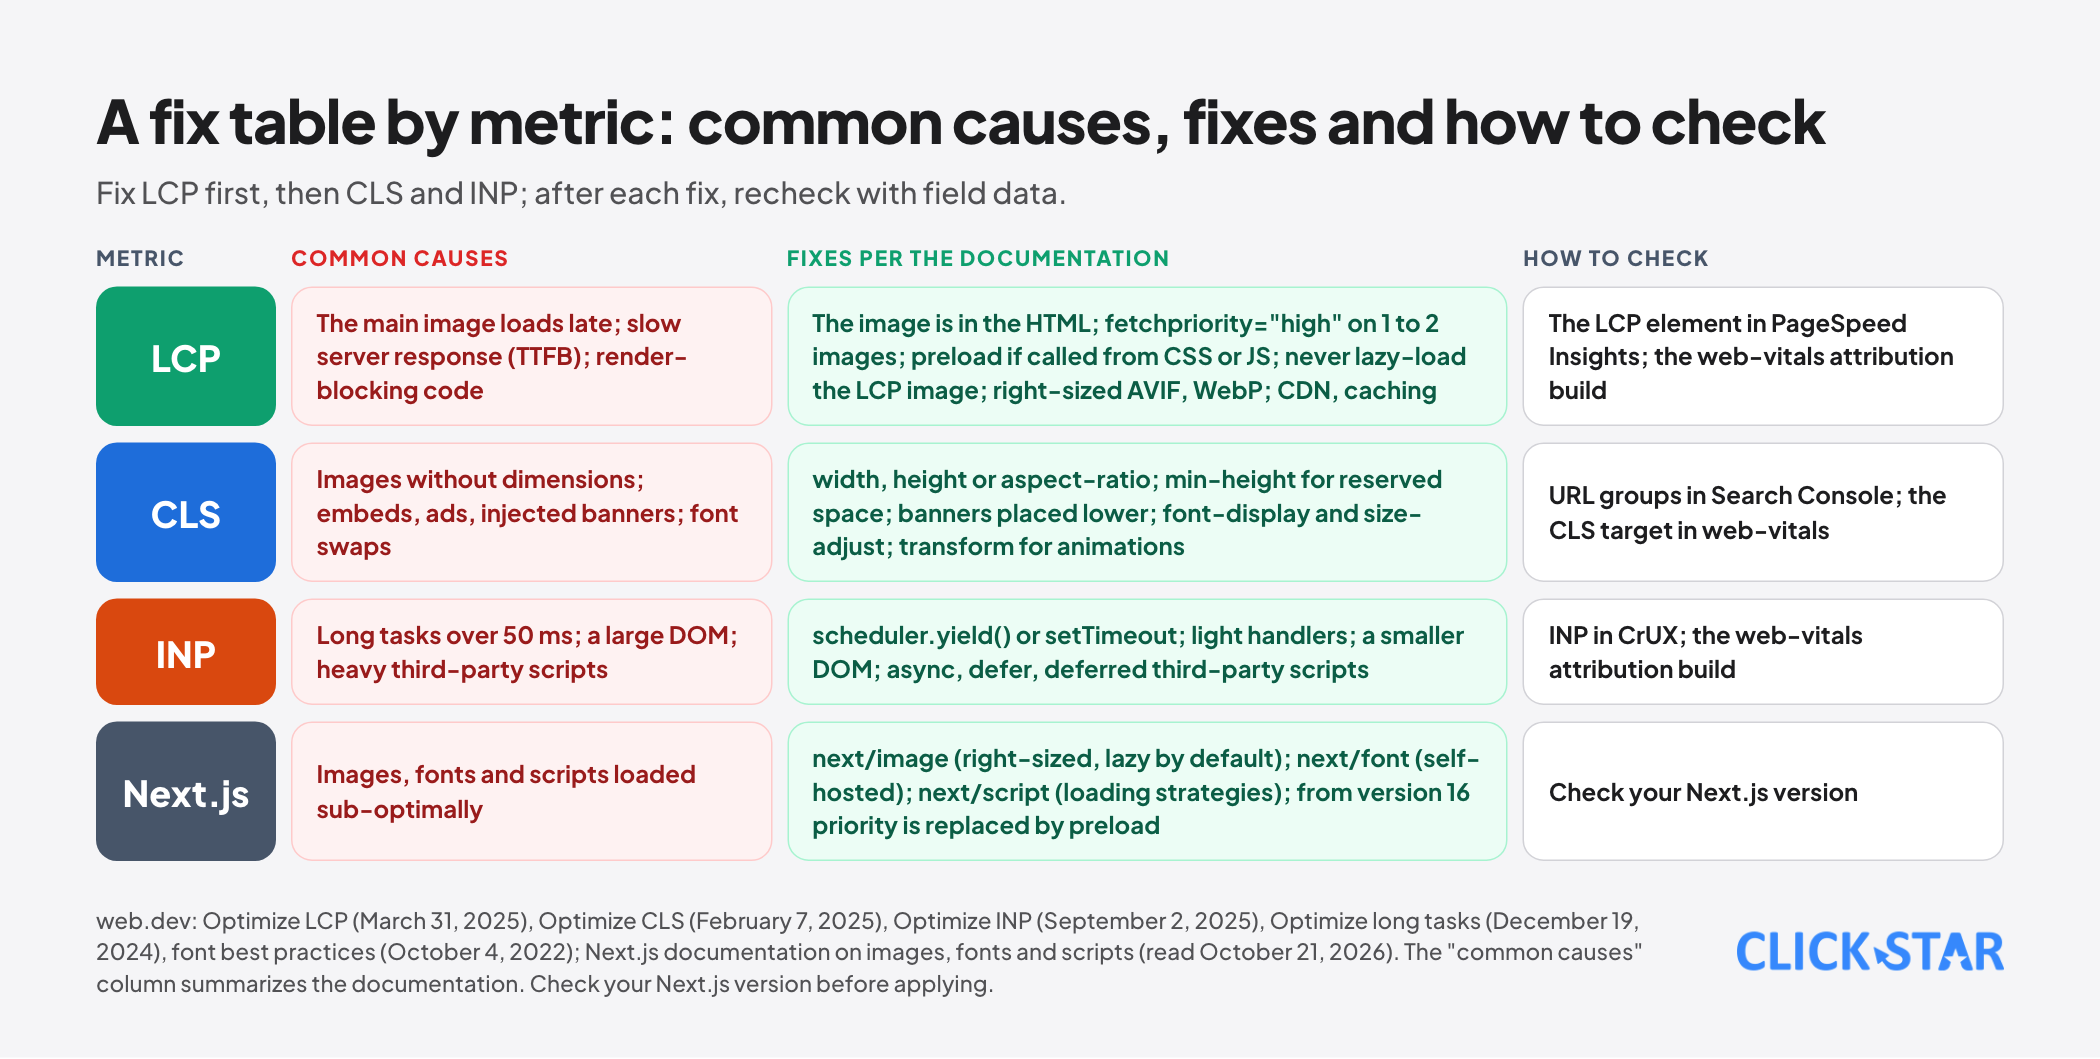
LCP. According to web.dev (March 31, 2025), LCP time splits into 4 parts with rough targets: server delay (TTFB) about 40%, resource load time about 40%, load start delay under 10% and render delay under 10%. The LCP image must be in the initial HTML; set fetchpriority="high" on 1 or 2 images likely to be the LCP, use preload if the image is called only from CSS or JavaScript, and never lazy-load the LCP image.
Use right-sized AVIF or WebP images, a CDN, caching and fewer redirects.
CLS. According to web.dev (February 7, 2025): set width and height or aspect-ratio on images and video; reserve space for ads, embeds and iframes with min-height; place injected banners or forms lower or reserve space; for fonts use font-display and size-adjust; use transform for animations; keep pages eligible for the back/forward cache (bfcache).
INP. According to web.dev (September 2, 2025), latency is the sum of input delay, processing time and presentation delay. Break up long tasks (over 50 milliseconds) with scheduler.yield() or setTimeout, keep handlers light and reduce DOM size.
Third-party code and fonts. Use async or defer, preconnect only for critical origins, lazy-load embeds below the first screen and consider self-hosting. That guidance is fairly old (2019). The Renault case lists shrinking the GTM container and cutting the number of fonts as part of its changes. For fonts, web.dev advises WOFF2, subsetting, self-hosting, fewer fonts and a deliberate font-display choice.
Next.js. Click Star's website runs on Next.js. Next.js documentation says next/image serves right-sized images in modern formats, lazy-loads by default and avoids CLS through width and height.
From Next.js 16 the priority prop is deprecated in favor of preload, and the documentation says in most cases loading="eager" or fetchPriority="high" should be used. next/font self-hosts fonts and makes no external requests. next/script has loading strategies, and third-party scripts should be loaded only on the pages that need them. Check which Next.js version you use before applying this.
The Vietnamese context
Click Star found no Core Web Vitals pass rate specific to Vietnam; that needs a CrUX query by country. On networks, according to Vietnamese press citing the Ookla Speedtest index, in August 2026 Vietnam's median mobile download speed was 219.93 Mbps (9th in the world, global median 109.05) and fixed broadband was 301.48 Mbps (8th, global median 129.68).
This is a secondary source, crowdsourced from app users, and is download speed only.
Click Star's inference, not a measurement: when networks are fast, a slow website is more often due to heavy pages, too much JavaScript and weaker devices than to bandwidth. So check with field data on real mobile devices, not only on the web team's machines.
A 30-day plan
- Week 1: measure the current state with PageSpeed Insights (field data) and Search Console; record LCP, INP and CLS of the 5 most important pages on mobile.
- Week 2: fix LCP first (the main image, fonts, caching, render-blocking code) and CLS (image dimensions, reserved space for embeds).
- Week 3: review third-party code and INP; remove scripts no longer used and defer the rest.
- Week 4: switch on validation tracking in Search Console, wait for 28 days of data, and compare conversion before and after for each page.
Note: to compare conversion before and after, compare the same period of the week and exclude major ad campaigns, because a speed change is not the only thing that moves conversion.
What is not known
Click Star has no independent measurement of the revenue gain from improving speed at small Vietnamese businesses, and the case studies were all published by Google. There is no country-level CWV pass rate for Vietnam. The Ookla data was taken through the press and not read on the original page.
Google's wording on ranking was read through a summarizing tool and needs checking on the original pages. Click Star has not checked the guidance on GTM in @next/third-parties.
Common mistakes
- Using a Lighthouse score as the target instead of field data at the 75th percentile.
- Measuring only on the web team's desktop and fast network, ignoring real mobile devices.
- Lazy-loading the LCP image, which makes the most important image appear slowly.
- Not setting image dimensions and reserved space for embeds, causing layout shifts.
- Adding third-party tags and scripts continually without reviewing them.
- Expecting a fixed revenue gain from the case studies of large brands.
- Concluding right after a fix, when field data needs about 4 weeks to reflect it fully.
Related posts
Need tailored advice for your business?
Click Star helps you build a solution that fits your industry and scale. We answer every question during business hours.