Slow PostgreSQL Queries: Reading EXPLAIN and Choosing Indexes
How to read EXPLAIN, choose an index type and safely diagnose slow PostgreSQL queries, based on the PostgreSQL 18 and Supabase documentation and examples run on fake data.
Slow queries make applications, reports and admin pages freeze. The usual reflex is an index on every column, but every index adds cost to writes.
This article draws on the PostgreSQL 18 documentation (current version; the pages cited show no update date), Supabase documentation and examples Click Star ran on PostgreSQL 16.2 with fake data, checked on October 23, 2026. The examples show the shape of plans and are not performance measurements.
Key points
- EXPLAIN shows the planned execution; EXPLAIN ANALYZE runs the query and adds actual figures. Compare estimated rows with actual rows first.
- Cost is an arbitrary unit, not milliseconds. EXPLAIN ANALYZE changes real data on write statements, so wrap it in BEGIN and ROLLBACK.
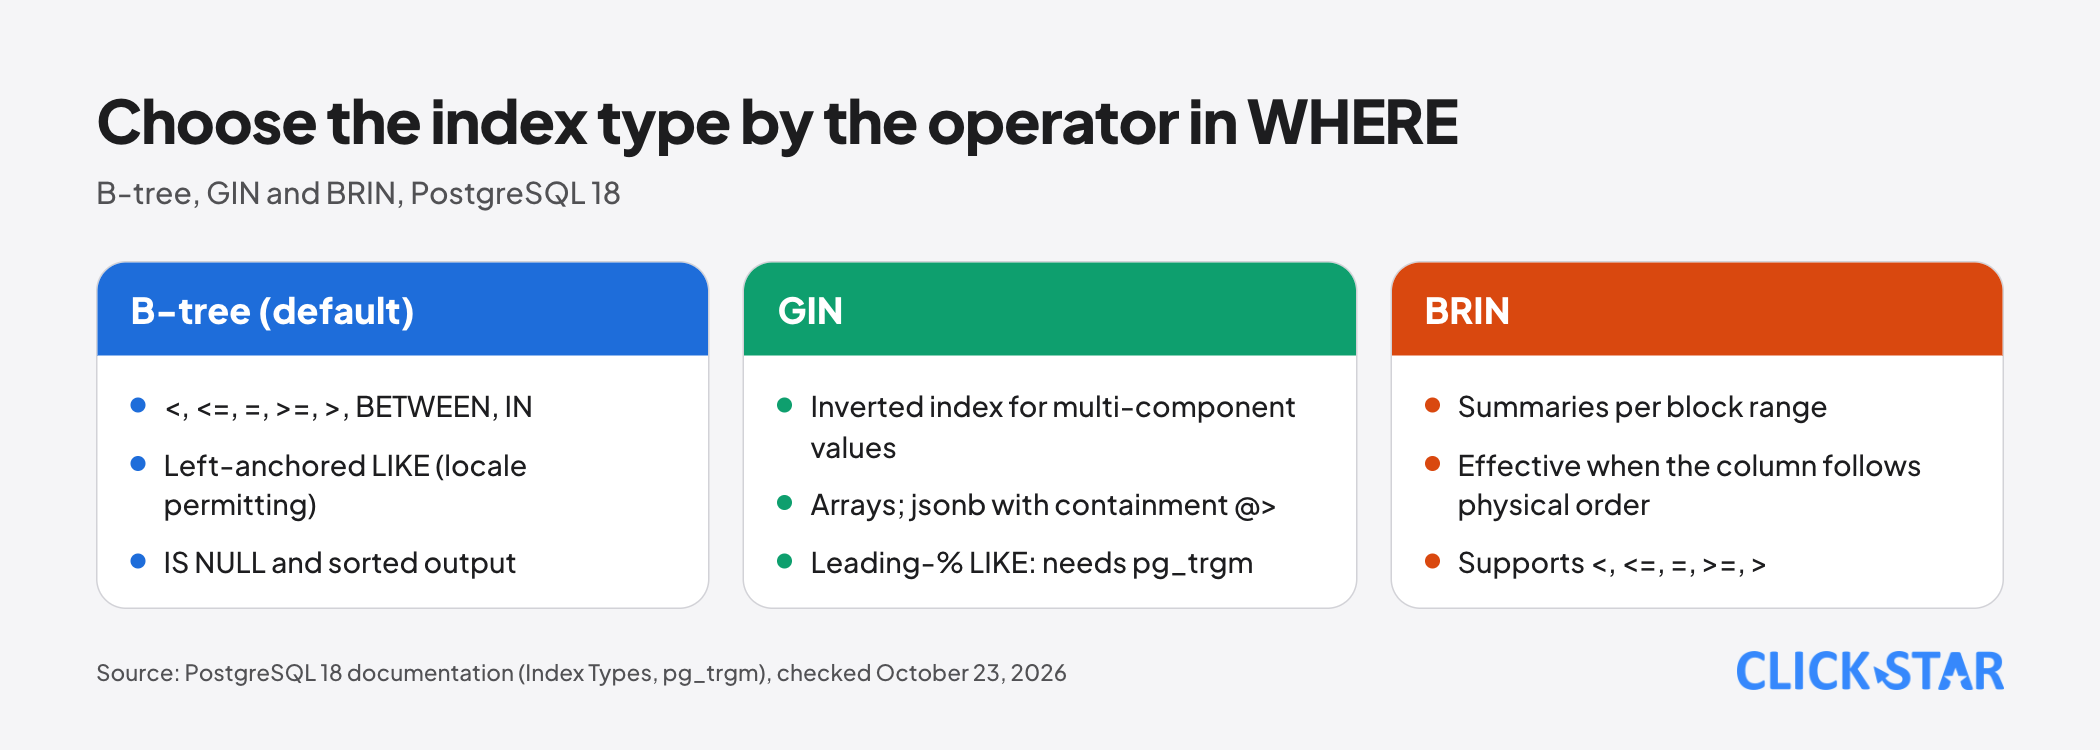
- B-tree serves equality, ranges and left-anchored LIKE (locale permitting); GIN serves arrays, jsonb and leading-% LIKE (via pg_trgm); BRIN suits columns in physical order.
- Indexes have a price: the example shows 4 extra indexes more than doubled WAL for 50,000 inserts (depending on index type).
- Common causes: functions wrapped around columns, LIKE with a leading %, foreign keys without an index, stale statistics.
- Find the costliest queries with pg_stat_statements, change 1 thing at a time, build live indexes with CONCURRENTLY.
Why a query becomes slow
According to the PostgreSQL 18 documentation, without an index the system scans the whole table row by row; with an index, it walks a few levels of a search tree. The planner chooses using an estimate of matching rows from ANALYZE statistics, which are always approximate.
Per the Using EXPLAIN section, a table of 1 disk page is almost always scanned sequentially, so small-table tests do not carry over to large tables.
How to read EXPLAIN and EXPLAIN ANALYZE
Per the EXPLAIN section of the PostgreSQL 18 documentation, a plan is a tree of nodes: bottom nodes read tables (sequential, index or bitmap scans), upper nodes join or sort. Each node shows start-up cost, total cost, estimated rows and row width. Cost is an arbitrary unit, not milliseconds.
With ANALYZE, each node also shows actual time, actual rows and loops. The documentation says the key check is whether estimated rows are close to actual rows. For a node that runs several times, time and rows are per-run averages, so multiply by loops.
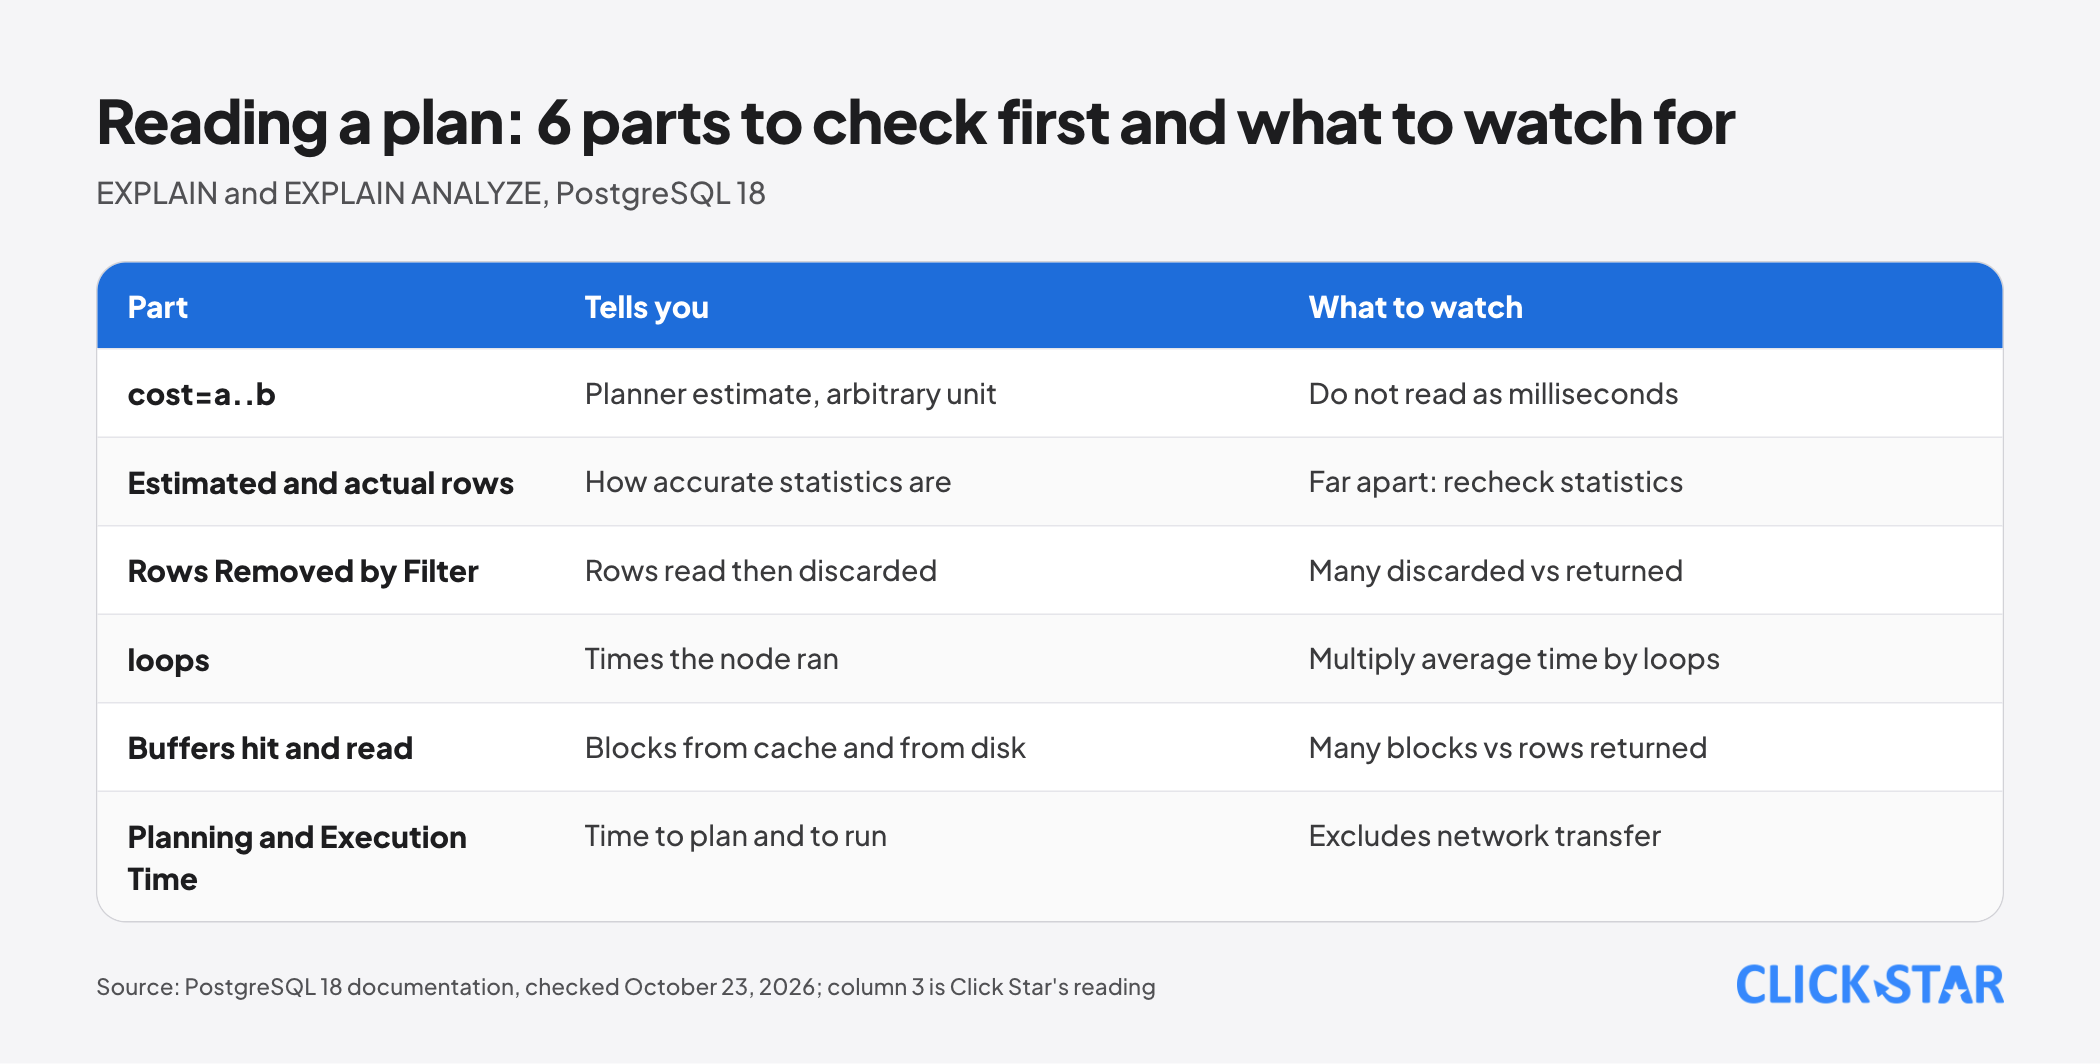
"Rows Removed by Filter" shows rows a node read and discarded; Buffers shows blocks from cache (hit) or disk (read). The plan ends with Planning Time and Execution Time, excluding network transfer. Per the PostgreSQL 18 release notes (September 25, 2025), EXPLAIN ANALYZE now enables BUFFERS automatically.
EXPLAIN ANALYZE really runs the statement. For INSERT, UPDATE, DELETE or MERGE, the documentation says to wrap it in a transaction and roll back:
- BEGIN;
- EXPLAIN ANALYZE UPDATE orders SET status = 'paid' WHERE id = 10;
- ROLLBACK;
The data is rolled back, but the statement still uses resources while it runs, and per-node timing can add overhead on machines with a slow clock call.
Example: from sequential scan to index
Illustrative Click Star example, not a measurement: PostgreSQL 16.2, an orders table of 200,000 rows and a customers table of 20,000 rows made with generate_series. The query fetches the orders of 1 customer:
- EXPLAIN (ANALYZE, BUFFERS) SELECT id, total_vnd FROM orders WHERE customer_id = 1234;
Without an index, the plan scans sequentially: it discards 199,990 rows and touches 2,667 blocks to return 10 rows. After the index below, it uses a bitmap index scan and touches 15 blocks.
- CREATE INDEX orders_customer_id_idx ON orders (customer_id);
Choosing an index type by WHERE operator
Per the Index Types section, CREATE INDEX builds a B-tree by default, and the type decides which operators it can serve. The documentation lists 6 built-in types; Click Star summarizes 3 (Hash handles equality only):
- B-tree: <, <=, =, >=, >, BETWEEN, IN, IS NULL, left-anchored LIKE (outside the C locale it needs a special operator class), sorted output.
- GIN: an inverted index for multi-component values such as arrays; for jsonb it supports the containment operator @>.
- BRIN: summaries per block range, effective for columns that match the table's physical order, supporting <, <=, =, >=, >.
A multicolumn index is most efficient with a condition on the leftmost column and rarely helps beyond 3 columns. PostgreSQL 18 adds skip scan, mainly useful when the leading column has few distinct values.
A partial index holds only rows matching its own WHERE condition. In the example, 1% of orders are pending; an index for that group is 64 kB, against 4,408 kB for a full index on created_at. The query needs a matching condition.
- CREATE INDEX orders_pending_idx ON orders (created_at) WHERE status = 'pending';
Indexes have a price: slower writes, more space
Per the documentation, keeping an index in sync adds cost to every write and can prevent heap-only tuples, so rarely used indexes should be dropped. In the example, inserting 50,000 rows into a table with only a primary key produced about 9.4 million bytes of WAL; with 4 more indexes, about 26.2 million, and index size grew from 1,112 kB to 6,880 kB.
To find surplus indexes, check pg_stat_user_indexes (idx_scan, and last_idx_scan from PostgreSQL 16); Supabase Advisors also flag unused, duplicate and unindexed-foreign-key cases.
Per the CREATE INDEX section, the command normally blocks writes (reads continue) until done. With CONCURRENTLY writes continue, but the table is scanned 2 times and it takes noticeably longer; it cannot run in a transaction block, and on failure it leaves an INVALID index to drop and rebuild.
- CREATE INDEX CONCURRENTLY orders_customer_id_idx ON orders (customer_id);
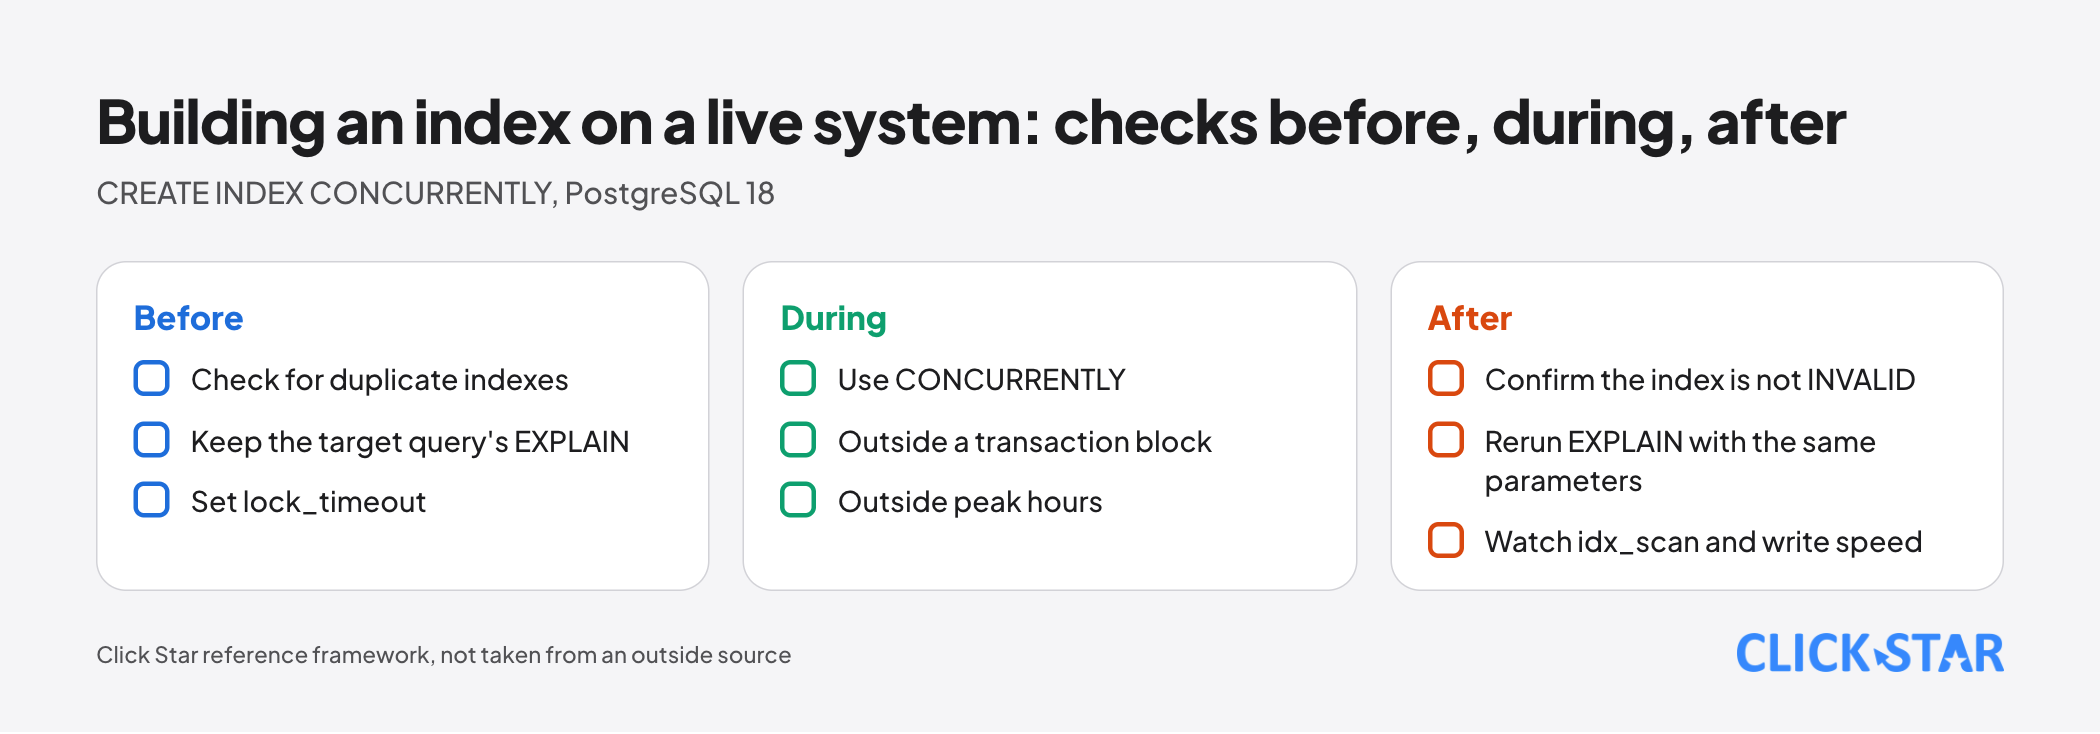
Click Star reference framework, not from an outside source. Before: check for duplicate indexes, keep the EXPLAIN of the target query, set lock_timeout. During: use CONCURRENTLY, outside a transaction block and peak hours. After: confirm it is not INVALID, rerun EXPLAIN with the same parameters, watch idx_scan and write speed.
Why indexes do not get used
An index serves conditions of the form column, operator, value; an expression index needs the query to match the expression (index introduction). Below are 5 problems Click Star reproduced on PostgreSQL 16.2 or found in the documentation.
1. A function or cast wrapped around the column. The condition created_at::date = DATE '2026-03-15' forces a sequential scan (2,667 blocks). As a half-open range on the raw column, it uses a B-tree index on created_at and touches 27 blocks:
- SELECT count(*) FROM orders WHERE created_at >= '2026-03-15' AND created_at < '2026-03-16';
An index on (created_at::date) was rejected with "functions in index expression must be marked IMMUTABLE": the 16.2 catalog classes date(timestamptz) as STABLE (it depends on the session time zone). Naming the time zone works if the query uses the same expression:
- CREATE INDEX orders_created_date_vn_idx ON orders (((created_at AT TIME ZONE 'Asia/Ho_Chi_Minh')::date));
2. Case-insensitive comparison. lower(email) = '[email protected]' scans sequentially (19,999 rows discarded) until an expression index exists:
- CREATE INDEX customers_lower_email_idx ON customers (lower(email));
3. LIKE with a leading %. B-tree serves only start-anchored patterns. In the test, LIKE '%[email protected]' still scanned sequentially despite a B-tree index on email. The pg_trgm documentation says a trigram index supports unanchored LIKE; Click Star could not run it (the test machine lacks the module), so the syntax comes from the documentation:
- CREATE EXTENSION pg_trgm;
- CREATE INDEX customers_email_trgm_idx ON customers USING gin (email gin_trgm_ops);
4. A foreign key without an index on the child table. The documentation says a foreign key does not create an index on the referencing column, while deleting a parent row requires scanning the child table. In the example, deleting 1 customer with no orders took several milliseconds without the index and under 1 millisecond with it (illustrative; repeat runs vary).
5. Stale statistics. Autovacuum runs ANALYZE when changed rows pass 50 rows plus 10% of the table (defaults). In the example, a table with autovacuum off was analyzed with 50,000 kind = 'view' rows, then 50,000 'purchase' rows were inserted; the query estimated 1 row against 50,000 actual; after ANALYZE the estimate became 49,987 and the plan switched to a bitmap scan.
Finding which queries to fix with pg_stat_statements
Per the documentation, pg_stat_statements tracks planning and execution statistics of all SQL statements. Add it to shared_preload_libraries (restart required), then run CREATE EXTENSION in each database. On Supabase, enable it in the Dashboard under Extensions.
The query below sorts by total time to show the costliest statements (syntax checked on a dummy table); sort by mean_exec_time for queries slow on every call.
- SELECT queryid, calls, round(total_exec_time::numeric, 1) AS total_ms, round(mean_exec_time::numeric, 2) AS mean_ms, rows, left(query, 80) AS query_start FROM pg_stat_statements ORDER BY total_exec_time DESC LIMIT 10;
Constants become $1, $2, but can still appear when entries are evicted often (documentation). Also, log_min_duration_statement logs slow statements, and auto_explain logs their plans, recording parameter values in full by default (auto_explain.log_parameter_max_length), which may include customer data.
Vietnam context and Supabase
Click Star found no public measurements of slow queries at Vietnamese businesses; conclusions rest on documentation and fake-data examples.
The Supabase query optimization guide (no date shown, read October 23, 2026) matches the PostgreSQL documentation and advises dropping an index that does not lower plan cost. For row level security (RLS), the Supabase RLS guide advises indexing every column a policy filters on, noting a primary key (team_id, user_id) mainly serves team_id.
Click Star's view. Indexes are powerful but not free; measure first, fix the query or statistics, then add an index. Click Star builds custom software, CRM, CDP and data dashboards, so it has a commercial interest when a business needs those services; this view rests only on public documentation.
What to do: 5 steps and how to measure
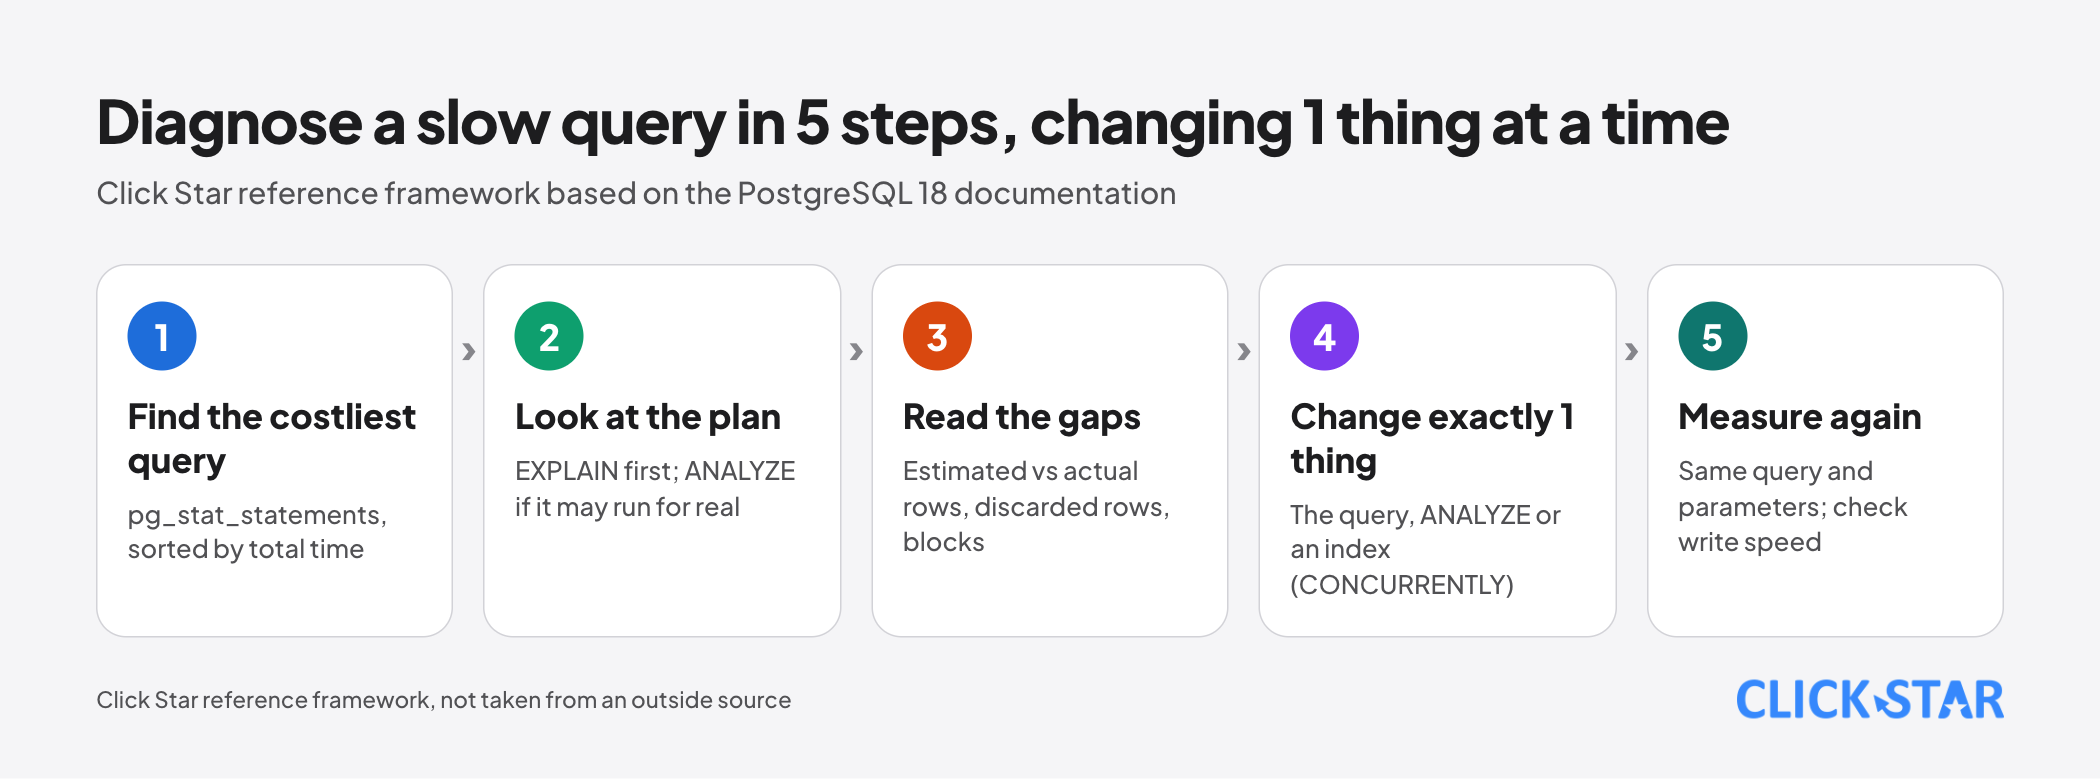
A Click Star reference framework, not taken from an outside source, matching the first image:
- Step 1: find the costliest queries with pg_stat_statements, not by guessing.
- Step 2: run EXPLAIN first, add ANALYZE only if the statement may run for real; set session time limits.
- Step 3: read the gaps: estimated versus actual rows, discarded rows, blocks touched.
- Step 4: change exactly 1 thing (the query, ANALYZE or an index) and build indexes with CONCURRENTLY.
- Step 5: measure again with the same query and parameters, then check write speed.
Set time limits per session (the documentation advises against postgresql.conf):
- SET statement_timeout = '30s';
- SET lock_timeout = '5s';
RESET statement_timeout before a long index build: a CONCURRENTLY build cancelled midway can leave an INVALID index.
How to measure: total time and calls in pg_stat_statements before and after, blocks touched and rows discarded in EXPLAIN, and WAL via the WAL option of EXPLAIN.
Common mistakes
- Adding an index on every column "just in case".
- Reading EXPLAIN cost as milliseconds, or drawing conclusions from a tiny test table.
- Running EXPLAIN ANALYZE on a write statement without BEGIN and ROLLBACK.
- Building an index on a table that is being written to without CONCURRENTLY.
- Wrapping a column in a function or cast and then wondering why the index is not used.
- Forgetting indexes for foreign keys and columns in RLS policies, or pasting plans containing customer data into outside tools.
What is not known
Click Star has no measurements of improvement on real systems at Vietnamese businesses; the examples are 1 to 2 runs on fake data, not real load. pg_trgm and pg_stat_statements were checked only against the documentation.
No public source gives a general threshold for a "slow query" or how many indexes a table should have. Ask a database specialist for very large or partitioned tables.
Related posts

Need tailored advice for your business?
Click Star helps you build a solution that fits your industry and scale. We answer every question during business hours.