How people use AI and which models are popular (October 2026): one question, 5 measurements, 5 answers
Sets 5 measurements of AI share side by side (Similarweb, Sensor Tower, StatCounter, Pew, Ramp), explains why the answers differ, what people use AI for and how to choose a model by task with a 14-day trial plan.
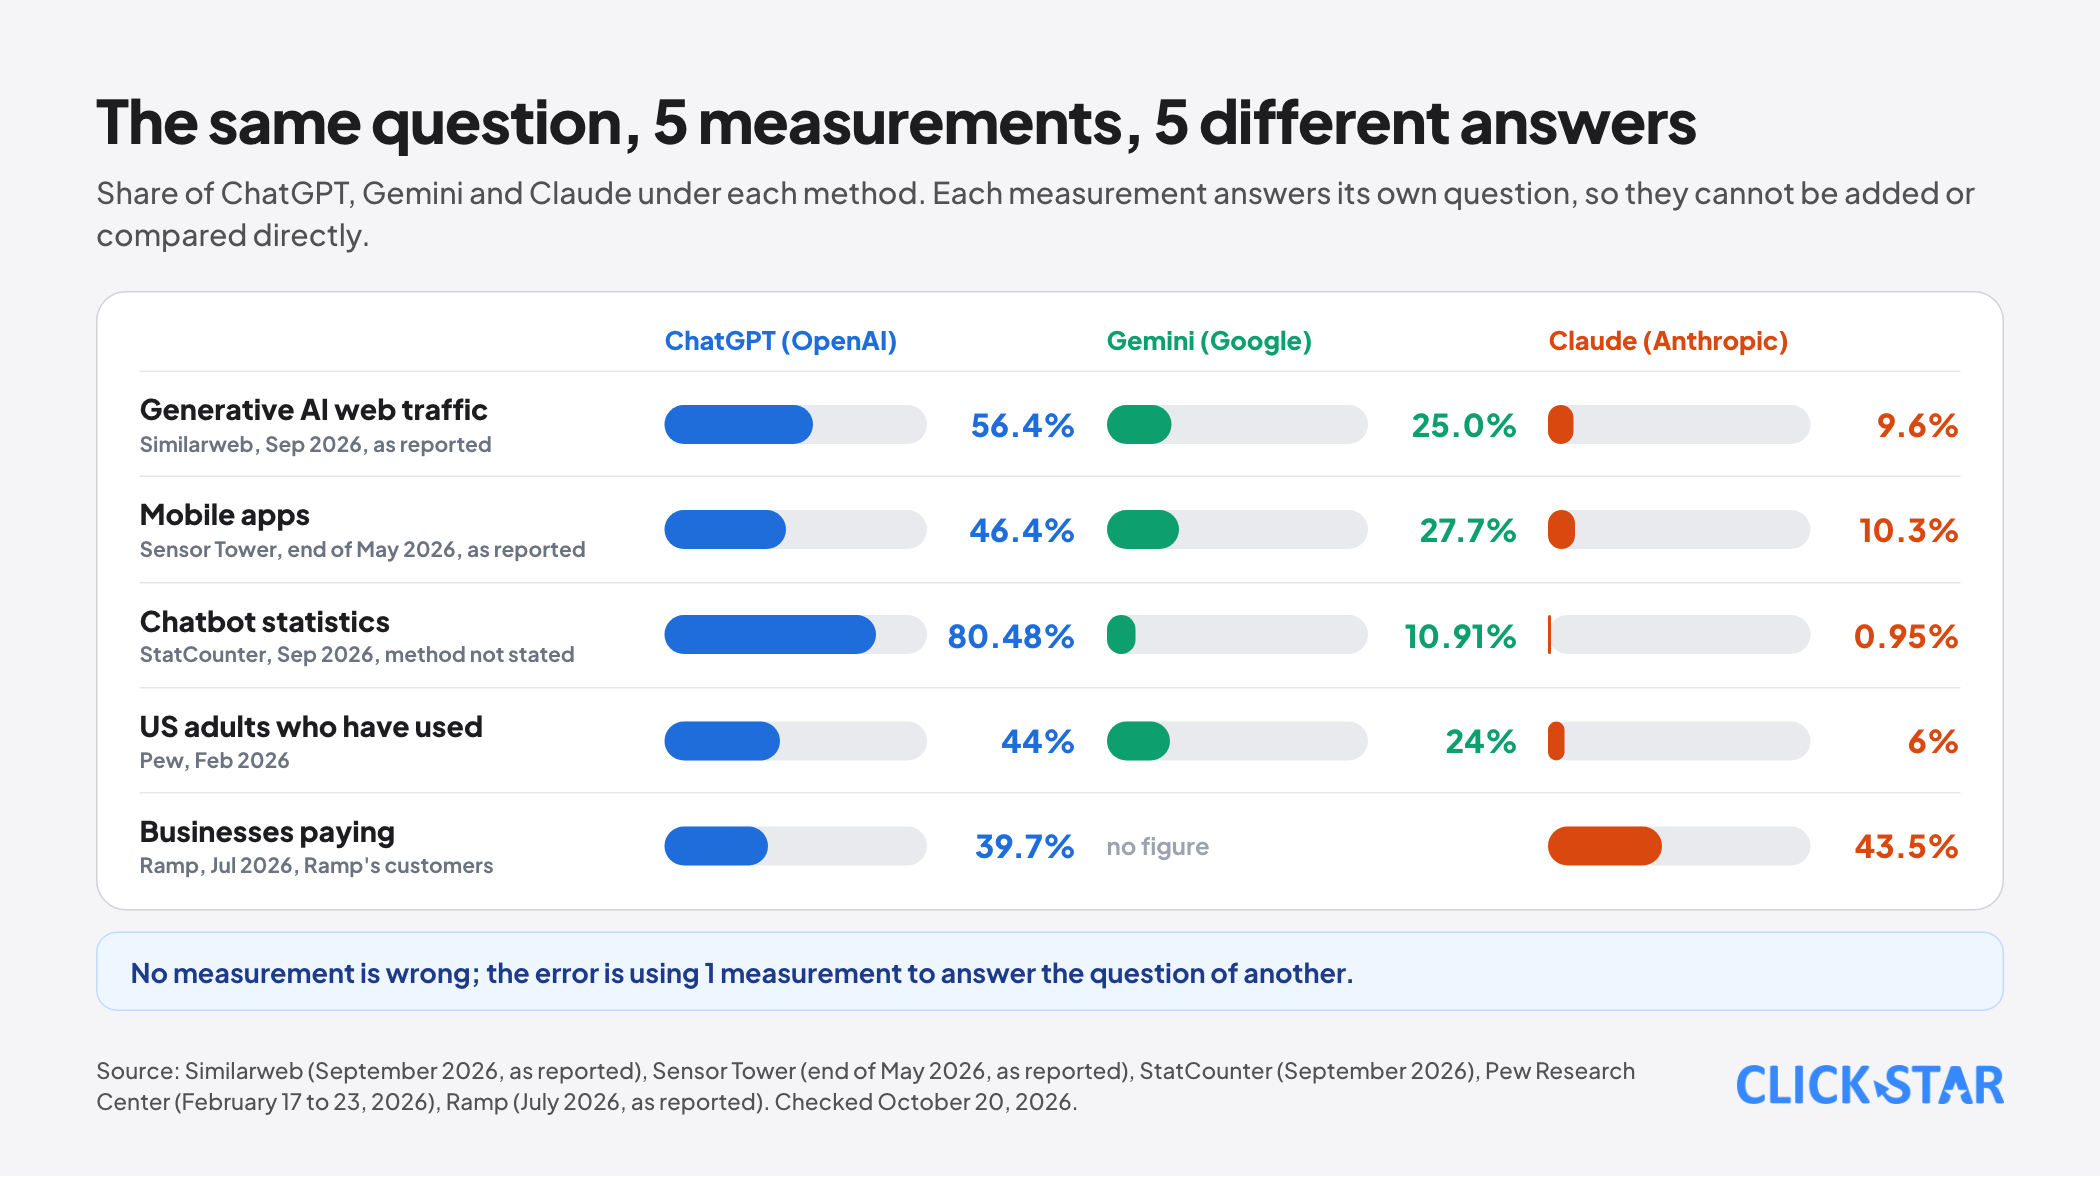
Ask "which AI is used the most?" and you will get different answers depending on who measures and what they measure. By website traffic, ChatGPT holds about 56% worldwide; by StatCounter's chatbot statistics the figure is 80%; in Pew Research Center's survey of US adults, 44% have used ChatGPT and 6% have used Claude.
And by business spending on the Ramp platform, Anthropic is ahead of OpenAI. This article sets 5 measurements side by side, explains why the answers differ, summarizes what people use AI for, states what can and cannot be measured about "popular models," and then gives a way to choose a model by task and a 14-day trial plan.
Figures are checked as of October 20, 2026; any figure that comes from a secondary source is labeled in the sentence. Click Star already has articles on the 10 most powerful AI tools, on AI usage statistics by country and on analyzing the Claude models; this one focuses on how to read trend measurements.
Key points
- There is no single "AI market share": web traffic, mobile apps, StatCounter's statistics, user surveys and business spending give 5 different answers, because each measurement answers a different question.
- ChatGPT leads every consumer-facing measurement, but its share has narrowed clearly: according to Similarweb, from about 76% of generative AI web traffic (June 2025) to about 53% (May 2026), then 56.4% (September 2026, per one report).
- Gemini and Claude grew fast in traffic: Gemini from under 9% to about 25 to 28%; Claude from about 2% to about 9 to 10%. But in StatCounter's statistics Claude is only 0.95%, which shows how much the answer depends on the method.
- On the business side, Ramp records Anthropic passing OpenAI in the share of businesses paying since April 2026; the July 2026 figure is 43.5% against 39.7%. This is Ramp's customer sample, not the whole US market.
- The most common consumer use is not work: OpenAI's study of ChatGPT (September 2025, reported through the press) shows non-work messages making up more than 70%, concentrated on practical guidance, seeking information and writing.
- There is no reliable public measurement of "popular models" at the level of individual versions for ordinary users; businesses should choose a model by testing it on their own work.
What people use AI for
Most consumer AI use is not work. According to a report on the study "How People Use ChatGPT" by OpenAI and economists (published September 2025; Click Star has not checked the original), non-work messages rose from 53% to about 73% over the year to June 2025.
The 3 leading groups are practical guidance (tutoring, how-to advice, creative ideas), seeking information and writing, together about 80% of use; writing is the most common task among work-related messages, about 40%.
On the Claude side, reports on the Anthropic Economic Index (January 2026 report, November 2025 data; Click Star has not checked the original) show that on Claude.ai, users collaborating with AI (learning, iterating, getting feedback) account for about 52% against 45% for handing work to AI to complete, while in the enterprise API automation is the majority.
Programming and computer and math tasks make up about a third of Claude.ai traffic. These figures describe each product's users and cannot be added into a single picture.
Click Star's view. The lesson for businesses is that your customers are used to AI for personal tasks before they use it for company tasks. They ask AI about your products by asking for information and comparisons, not by typing keywords. Content that "answers real questions" matters more than knowing exactly who tops the ranking.
Who uses which AI: 5 measurements side by side
Generative AI website traffic (Similarweb)
Similarweb measures the share of worldwide visits to generative AI websites. According to Similarweb's statistics page (June 2025 to May 2026), ChatGPT's share fell from about 76% to about 53%, Gemini rose from under 9% to about 27 to 28%, and Claude rose from about 2% to nearly 9%.
One report of Similarweb's September 2026 data (posted on X on October 12, 2026; Click Star has not checked the original page) gives ChatGPT 56.4%, Gemini 25.0%, Claude 9.6%, DeepSeek 3.4%, Grok 2.3%, Copilot 1.5% and Perplexity 0.9%; the same source gives October 2025 as ChatGPT 71.8%, Gemini 13.6%, Claude 2.3%.
That means that since mid-year ChatGPT has edged back up in part and Gemini has edged down.
Another Similarweb finding worth remembering (March to May 2026, as reported): 461 million of ChatGPT's 494 million users also used Google in the same period. AI is adding to search engines rather than replacing them, at least for users in Similarweb's panel.
Mobile apps (Sensor Tower)
According to Sensor Tower's State of AI report published June 16, 2026 (through press coverage; Click Star has not checked the original report), ChatGPT fell below 50% of the consumer AI assistant market for the first time, at 46.4% at the end of May 2026; Gemini 27.7% and Claude 10.3%.
The same report gives Claude's paid conversion rate as 13%, the highest in the sector. How this "share" is measured in detail has not been checked, so it should be read only as one view of mobile apps.
StatCounter's chatbot statistics
According to StatCounter, worldwide AI chatbot shares in September 2026 are ChatGPT 80.48%, Gemini 10.91%, Perplexity 5.85%, Copilot 1.79%, Claude 0.95% and DeepSeek 0.02%.
StatCounter's page does not explain its method, so Click Star uses this number only to illustrate the gap between measurements: at the same moment, Claude is 0.95% here and about 9 to 10% in Similarweb's web traffic.
A survey of US adults (Pew Research Center)
Pew's survey, conducted February 17 to 23, 2026 (published June 17, 2026), shows the share of US adults who have ever used each chatbot: ChatGPT 44%, Gemini 24%, Copilot 17%, Meta AI 14%, Grok 8%, Claude 6% and Character.ai 3%. According to reports, about half of US adults use AI chatbots, up from about a third in 2024.
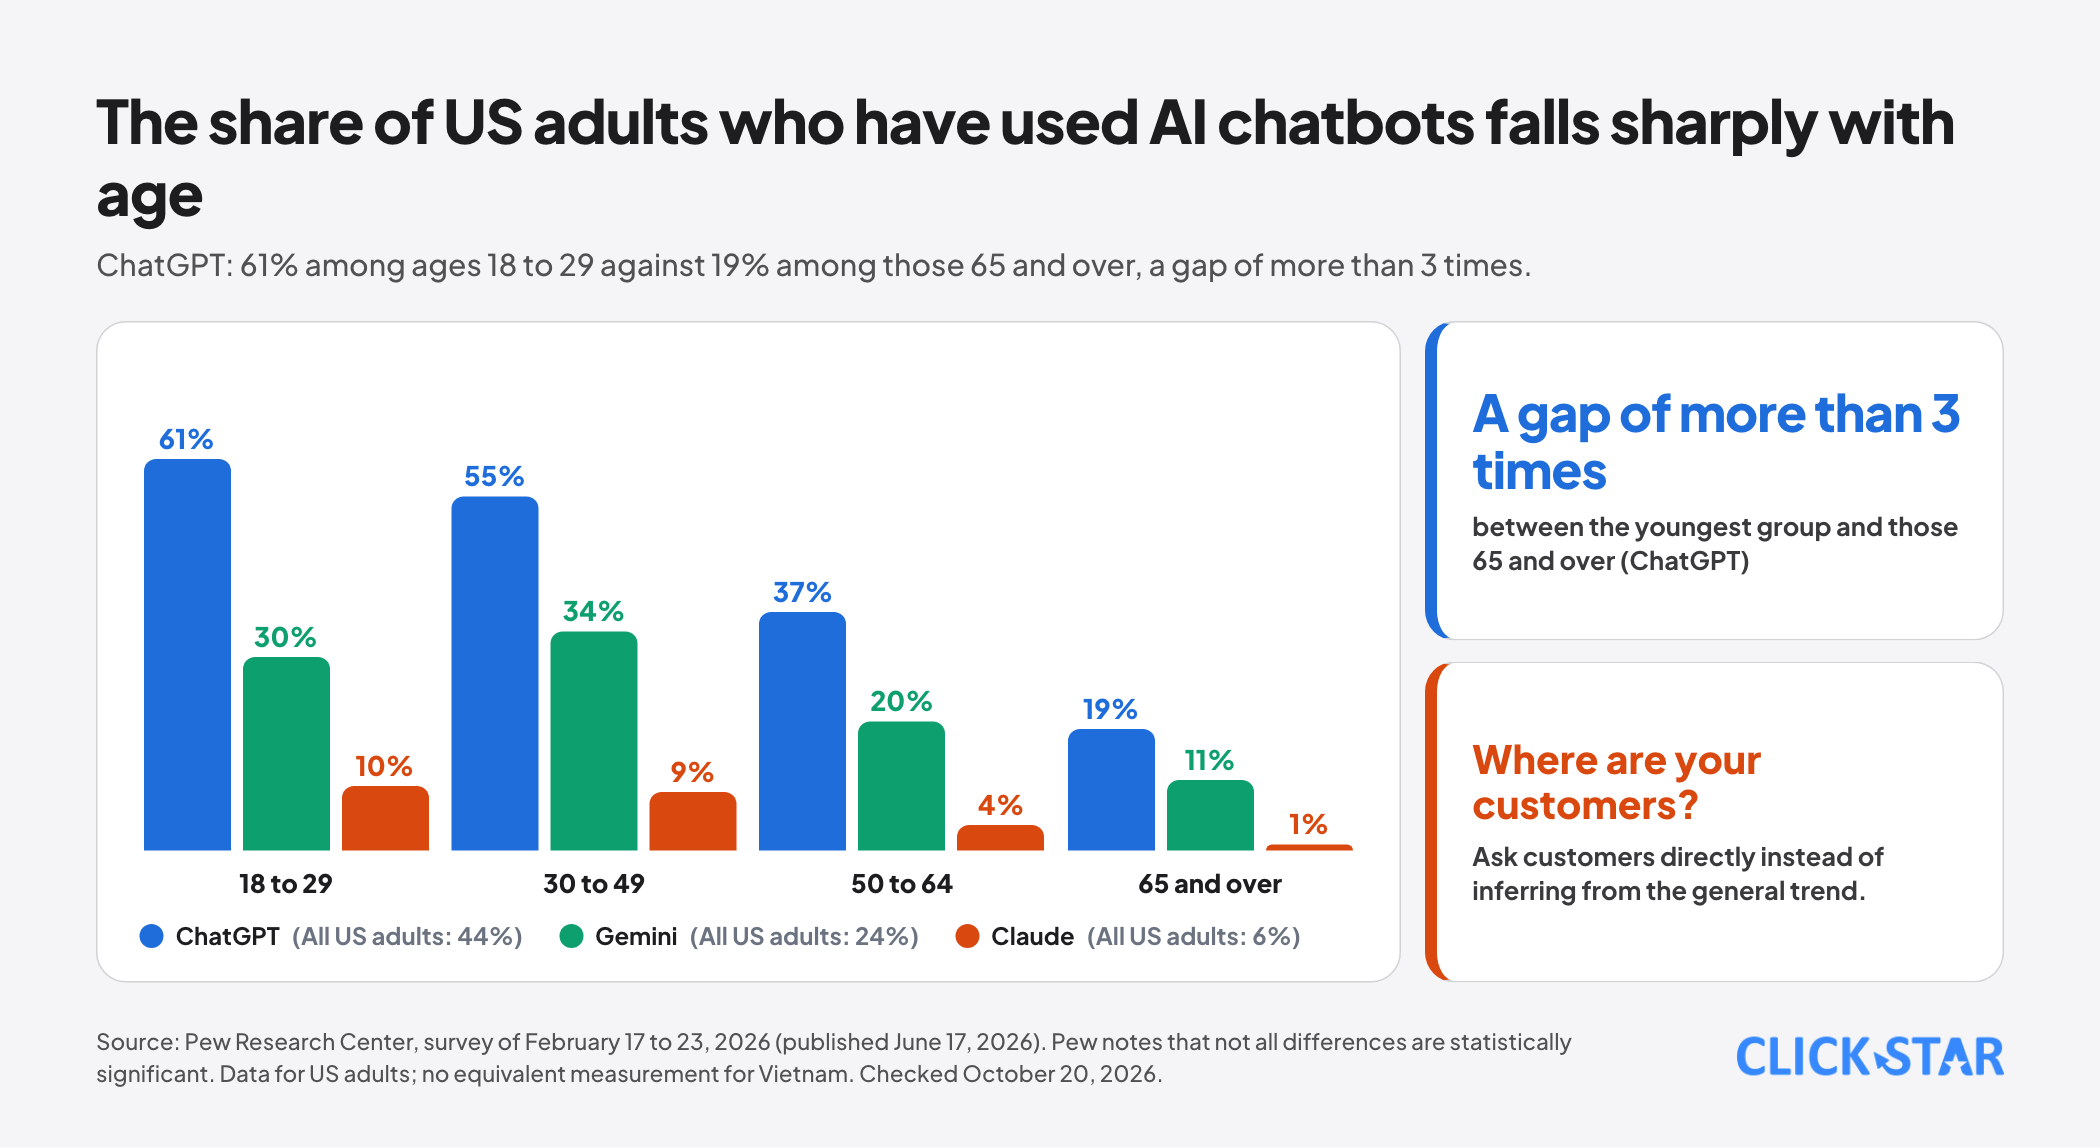
The age gap is large: ChatGPT 61% among ages 18 to 29 and 19% among ages 65 and over; Claude 10% among 18 to 29 and 1% among 65 and over. Pew notes that not all differences are statistically significant.
Business spending (Ramp)
Ramp tracks the share of businesses in its customer base that pay for each AI provider.
According to Ramp's summer 2026 report (through coverage; Click Star has not checked the original report), Anthropic passed OpenAI in the share of US businesses using it for the first time in April 2026; the July 2026 figures are Anthropic 43.5%, OpenAI 39.7%, with overall business AI adoption at 55.7%.
The August 20 update was reported as showing OpenAI growing faster in the third quarter. Remember this covers customers who pay through Ramp's cards and invoices; it does not represent all US businesses, let alone Vietnam.
Why the 5 answers differ
Each measurement answers its own question, and each has blind spots:
- Website traffic: counts visits to websites, missing AI embedded in apps, operating systems and coding assistants.
- Mobile apps: counts app users, missing desktop users, where much office work happens.
- StatCounter's statistics: the page does not state a method, so it is unclear whether the number measures usage or something else; read it only as one view.
- A survey of adults: asks "ever used," not how much, and only in the United States.
- Business spending: measures who pays, not who uses, and leans toward the customers of one payment platform.
The result is that ChatGPT leads every consumer-facing measurement, while Claude is stronger in measurements that lean toward business, professional work and paid use. No measurement is wrong; the error is using 1 measurement to answer the question of another.
"Popular models": what can and cannot be measured
Share by product (ChatGPT, Gemini, Claude) differs from share by individual model version. Most of the public figures above combine all versions of a product, and ordinary users usually do not choose the version. Version-level data mostly comes from API routing platforms, which reflect developers rather than ordinary users.
So the statement "model X is the most popular" almost always needs the addition "by which measurement, for whom."
For Claude, Click Star has official documentation on the current lineup (checked October 20, 2026): Fable 5.1, Opus 5.5, Sonnet 5.5 and Haiku 5.5, which differ in price, effort levels and lifecycle; the details are in the article analyzing the Claude models.
For other providers, Click Star does not name versions in this article because it could not check each provider's official documentation on October 20, 2026.
Click Star's view. Popularity is an indicator of market habits, not of quality for your work. Choose a model with a test on the exact kind of Vietnamese documents your business handles, measured by output quality, time and cost.
What this means for Vietnamese businesses
There is no equivalent measurement for Vietnam by model.
Click Star cited in earlier articles: Google says 89% of Gemini prompts in Vietnam are written in Vietnamese (Southeast Asia report, July 14, 2026); Sensor Tower, through VnExpress International, records ChatGPT and Gemini leading monthly users in Vietnam in the first half of 2026; and the AI user share in Vietnam reached 27.9% in the second quarter of 2026, 33rd in the world (as reported by the press on a Microsoft report).
These 3 sources measure 3 different things, and together they show demand for AI in Vietnamese is rising.
3 practical implications:
- Support several tools. Your customers and staff use several AI tools (and use Google as well); content, processes and policies should not depend on a single provider.
- Measure your own trend. Traffic from chatgpt.com, gemini.google.com, claude.ai and perplexity.ai in Google Analytics 4 shows what your customers are using, which is more reliable than a global ranking.
- Avoid lock-in. Choose an architecture that lets you swap models without rewriting processes, because rankings move every few months, as the figures above show.
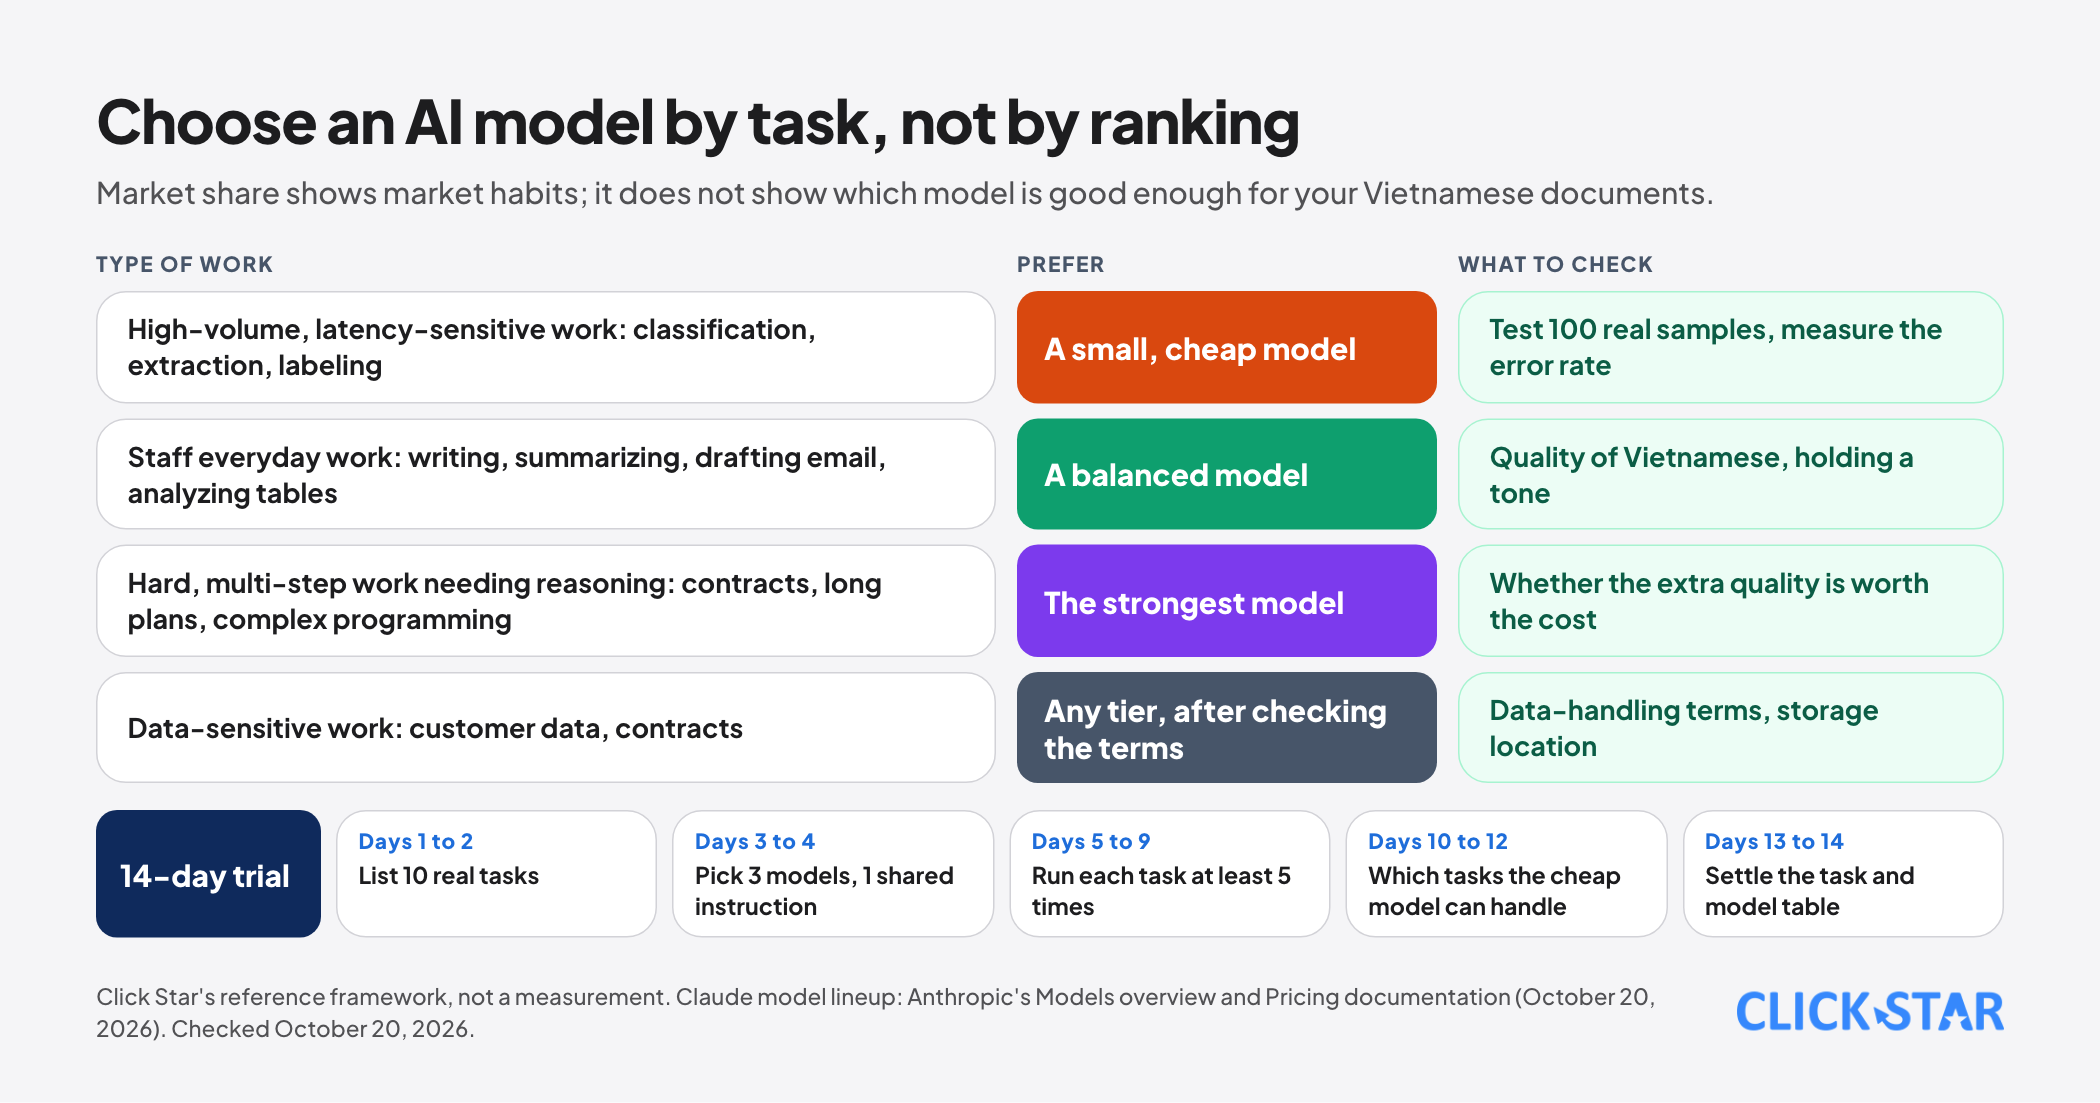
Choosing a model by task
The framework below is Click Star's reference framework, not a measurement:
- High-volume repeated work that is sensitive to latency (classification, extraction, labeling): prefer a small, cheap model; test it on 100 real samples.
- Staff's everyday work (writing, summarizing, drafting email, analyzing tables): prefer a balanced model; check the quality of Vietnamese and its ability to hold a tone.
- Hard, multi-step work that needs reasoning (contract analysis, long-range planning, complex programming): try the strongest model and measure whether the extra quality is worth the cost.
- Data-sensitive work (customer data, contracts): check each provider's data-handling terms and storage location before checking quality.
A 14-day trial plan
- Days 1 to 2: list 10 real tasks of the business, each with 1 sample document in Vietnamese.
- Days 3 to 4: choose 3 models to represent 3 levels (small, balanced, strong), and set up the same instruction for each task.
- Days 5 to 9: run each task at least 5 times with each model, recording quality (scored 1 to 5 by the person who will use the result), time and cost.
- Days 10 to 12: find which tasks have enough quality with the cheap model and which need the strong one; record typical failure cases.
- Days 13 to 14: settle the "which task uses which model" table and schedule a quarterly review.
Common mistakes
- Using 1 measurement to conclude about the market: web traffic, apps, StatCounter statistics and business spending are different questions.
- Choosing a model because it tops a ranking instead of because of results on your own documents.
- Treating US figures as Vietnamese figures; Pew, Ramp and many of the studies above measure the US market.
- Using secondary figures without stating their origin; most of the September 2026 figures above are reports of reports.
- Tying the whole process to one provider, then struggling when a model's price or lifecycle changes.
- Forgetting that figures change monthly; rankings need to be reviewed at least every quarter.
Related posts
Need tailored advice for your business?
Click Star helps you build a solution that fits your industry and scale. We answer every question during business hours.