A/B Testing Landing Pages and Email: Experiment Design, Sample Size and the Errors That Skew Results
How to design a trustworthy A/B test for a landing page or email: hypothesis, sample size calculated in Python, run time and the early-peeking trap. Based on Optimizely, GrowthBook, Evan Miller and Mailchimp.
Many businesses A/B test a landing page or email the familiar way: change a headline, wait a few days, pick the version that is ahead. This easily gives wrong answers: the sample is small, results are read too early, too many metrics are tracked, or visitors are split unevenly and nobody checks.
Based on documentation from Optimizely, VWO, Statsig, GrowthBook, Mailchimp and Apple, Evan Miller's post and research by Kohavi and Vermeer, checked October 22, 2026. Click Star ran the calculations in Python; the data is illustrative, not any client's result.
Key points
- Click Star's calculation (3% baseline, 20% smallest relative lift, 95% confidence, 80% power): 13,914 visitors per arm, 28 days if 1,000 new people enter the test each day and 140 days at 200.
- Stopping the moment a result looks significant inflates false positives: 26.1% in Evan Miller's example and about 22% in Click Star's simulation (checked daily), instead of 5%.
- Check the split ratio (SRM) before reading results; GrowthBook says results carrying an SRM warning cannot be trusted.
- Low-traffic sites can try a big change, a before-and-after comparison with stated limits, or user interviews. For email, use click rate, not open rate.
What an A/B test is and when to run one
An A/B test is a randomized controlled experiment: visitors are randomly split into groups, each sees 1 version, and the same metric is compared. Per Kohavi's group (KDD 2014, read October 22, 2026), a person gets the same experience across many visits.
Randomization is the mechanism: both groups face the same season, ads and weekly swings, so the remaining difference is tied to the change under test.
Hypothesis, primary metric and guardrail metrics
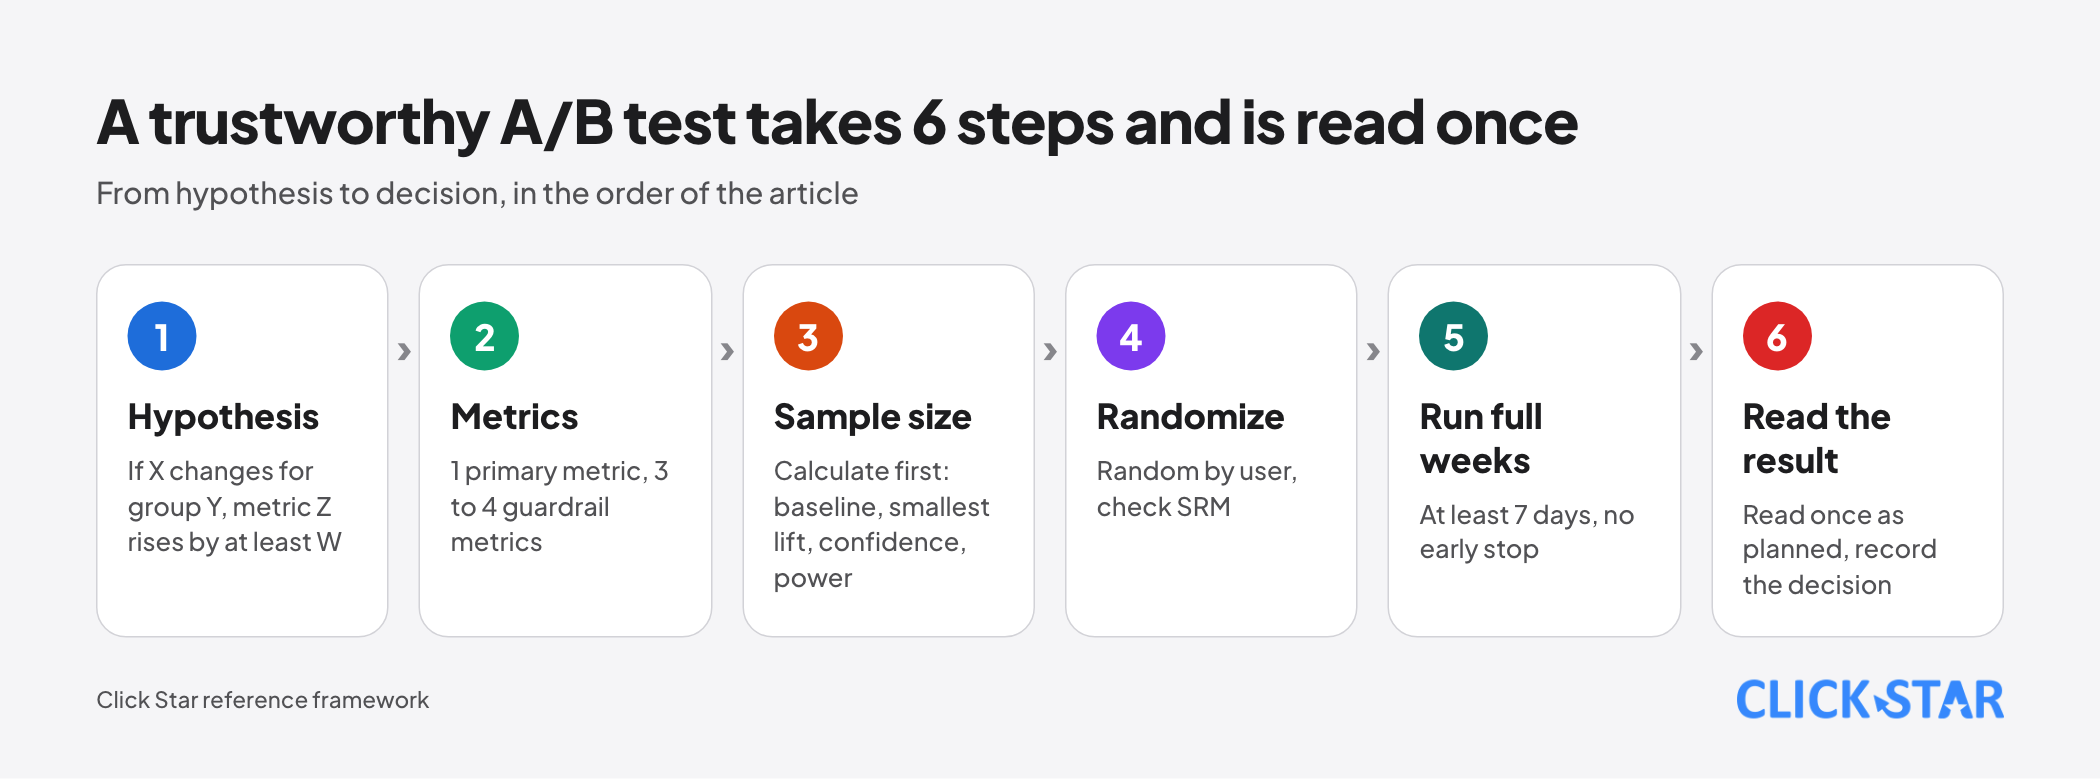
A test starts from a hypothesis that fits on 1 line. Click Star's template (reference framework, not from outside sources): "If X is changed for visitor group Y, metric Z rises by at least W because of R." W is the smallest lift worth detecting and sets the sample size.
Use a single primary metric, counted per user rather than per page view, for example people who submit the form divided by unique visitors.
A guardrail metric must not get worse while the primary one improves. Click Star's reference framework suggests 3 to 4: page speed, lead quality (share confirmed in the CRM) and, for email, unsubscribes and spam complaints.
Sample size: the formula and a real calculation
According to Optimizely (fixed horizon mode, undated page), sample size depends on the baseline, the smallest relative change to detect (MDE), the significance level and variance; its formula also includes power, the chance of detecting an effect that really exists.
For a conversion rate, Click Star uses the two-proportion test: n per arm = (z1 × √(2 × p̄ × (1 - p̄)) + z2 × √(p1 × (1 - p1) + p2 × (1 - p2)))² / (p2 - p1)². Here p1 is the baseline, p2 the expected rate and p̄ the average of p1 and p2.
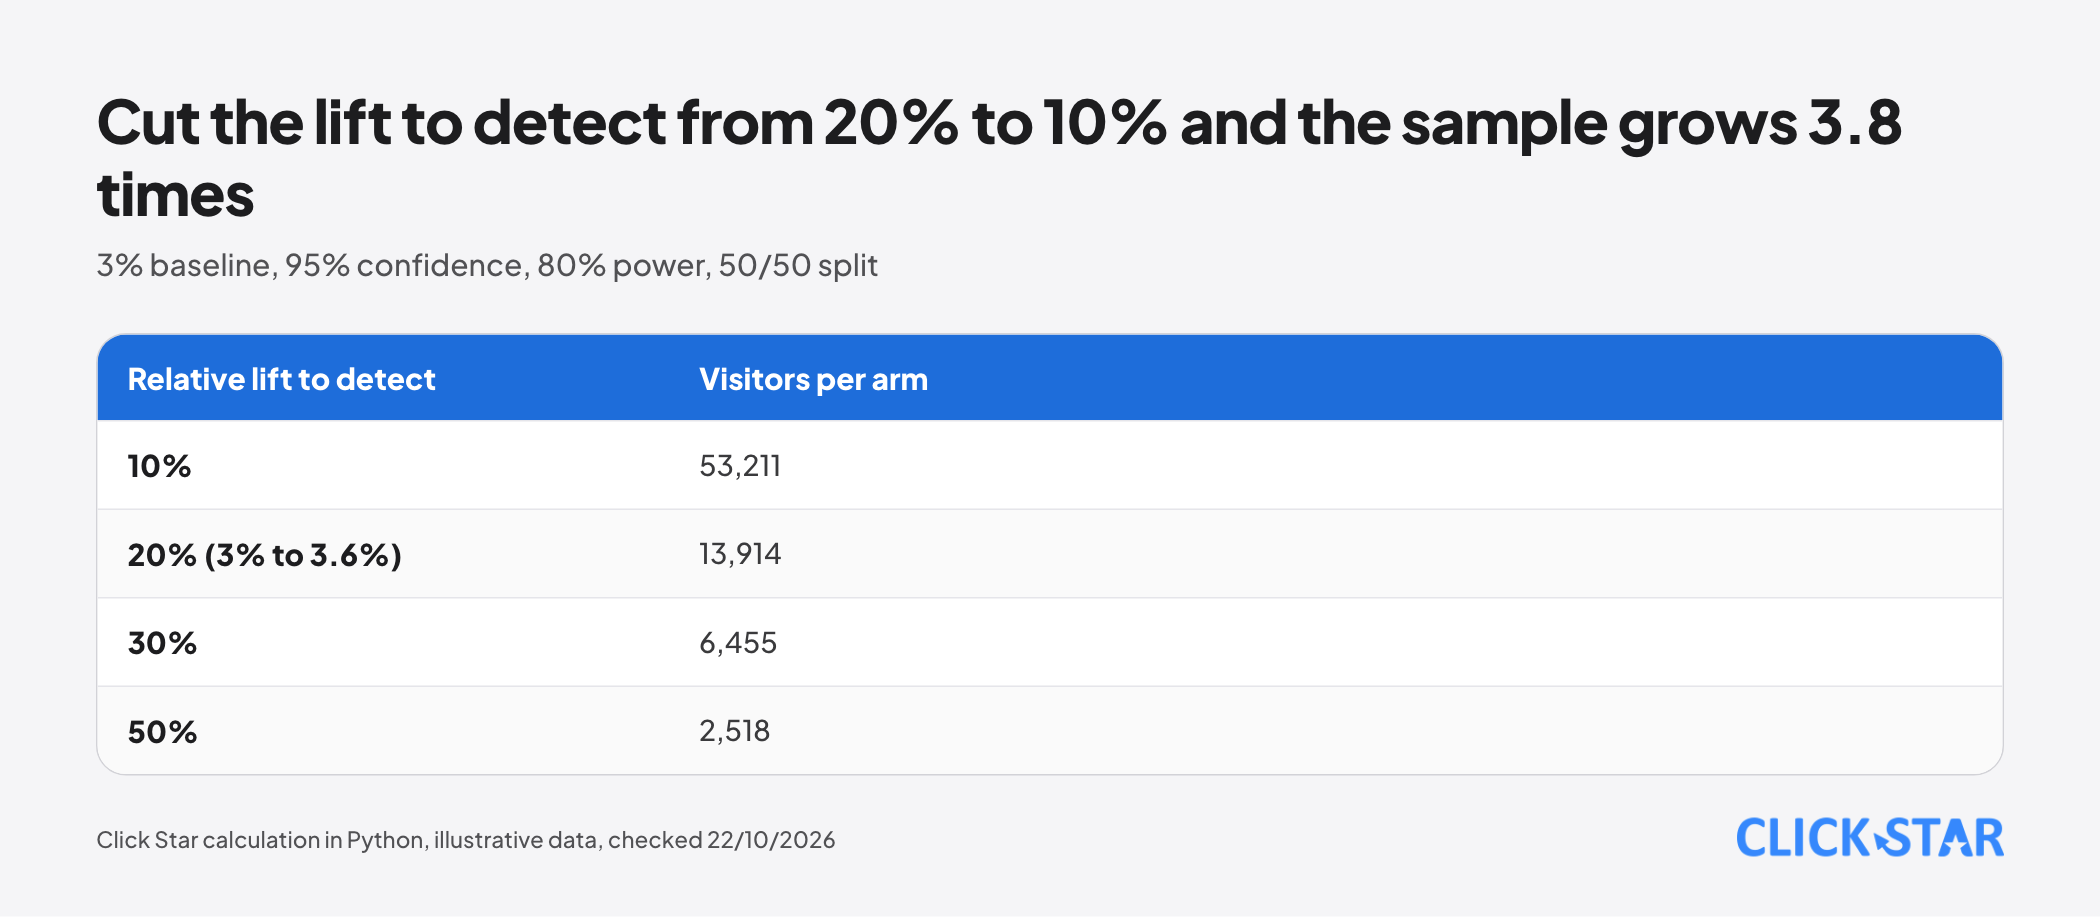
Assumptions (illustrative): 3% baseline; 20% smallest relative lift (3% to 3.6%); two-sided, 95% confidence (z1 = 1.95996); 80% power (z2 = 0.84162); 50/50 split. Python gives 13,914 per arm, 27,828 in total (rounding z to 1.96 and 0.84 gives 13,898).
At the same 3% baseline, a 10% lift needs 53,211 per arm, 30% needs 6,455 and 50% needs 2,518. 90% power needs 18,626; 90% confidence needs 10,960. Cutting the lift to detect from 20% to 10% multiplies the sample by 3.8.
Run time is total sample divided by the new people entering the test each day (unique visitors, not visits): 27,828 people need 28 days at 1,000 a day, 56 at 500 and 140 at 200. Returning visitors count once, so new people are often fewer than visits and the run is longer.
Metric type changes the minimum sample too. Kohavi's group (2014) gives 355 × skewness² as the minimum for the mean to be approximately normal; with Bing data, revenue per user (skewness 17.9) needs about 114,000 users per variant, capped revenue (skewness 5.2) about 9,700.
That is not the sample for detecting a revenue lift: with a 50/50 split the paper says the rule gives no useful lower bound, so use a power calculation. Small sites should favor conversion rate (Click Star's judgment).
Randomizing visitors and checking the split ratio (SRM)
Randomize by user, not by page view. Per GrowthBook (sticky bucketing docs), with cookies alone the same person can see 2 versions on 2 devices.
SRM is when the actual split differs from the plan. According to GrowthBook (read October 22, 2026), if you expect 50/50 and see something like 46/54, it runs a chi-squared test and warns only when p is below 0.001, so it depends on sample size. A result with a warning should not be trusted; find the bug and rerun.
Click Star's example (illustrative): a 50/50 split of 10,000 people. Seeing 5,000 and 5,200 gives p = 0.048, short of the threshold; seeing 4,800 and 5,200 gives p of about 0.00006, a clear problem.
GrowthBook calls tracking exposure separately from assignment the most common and severe cause. Run an A/A test (both groups see the same page) to check the split and measurement. If a result looks unusually good, suspect measurement first: Kohavi's group (2014) cites Twyman's law, that an unusually interesting figure is usually wrong.
How long to run: full weeks and novelty effects
Run until the sample is reached and at least 7 days, rounded up to whole weeks. Optimizely advises at least 1 business cycle (7 days) because weekend and weekday visitors differ; VWO (updated September 24, 2026) also cites 7 days, longer for seasonality or big changes.
Kohavi's group (2014) advises 2 weeks to catch novelty effects, though they say these are uncommon. Avoid abnormal periods: Mailchimp notes Black Friday week is not typical, and Tet in Vietnam is similar (Click Star's inference).
Peeking at results early raises false positives
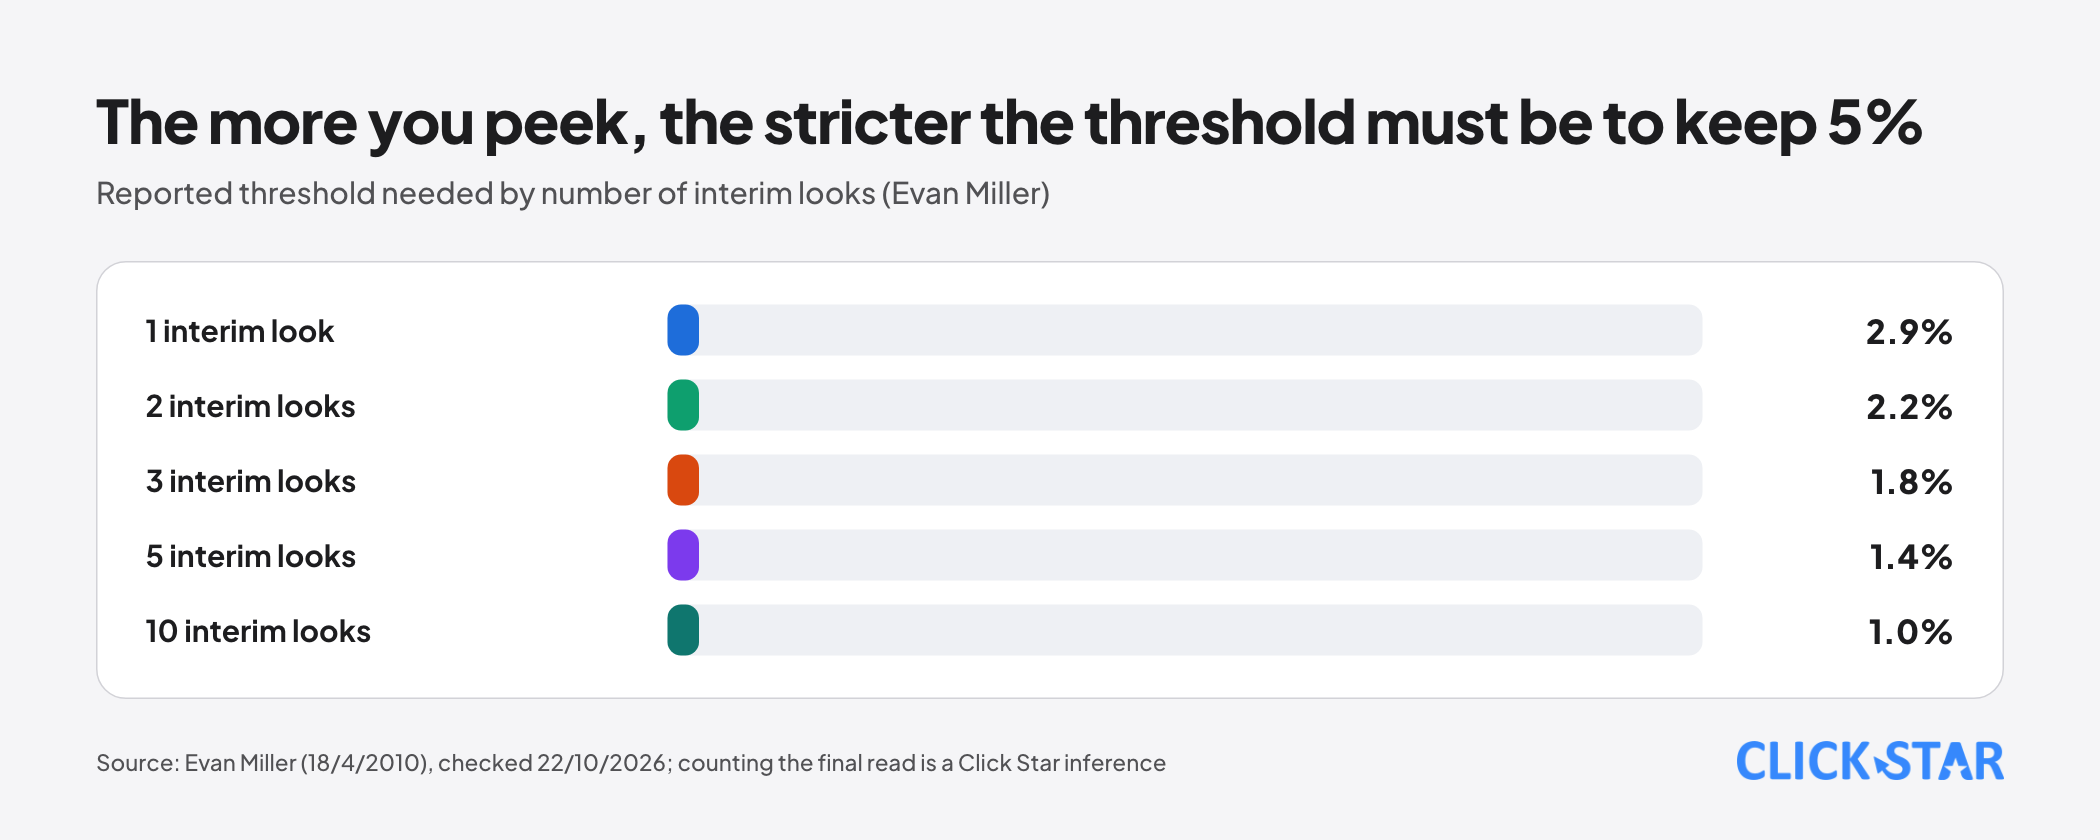
A false positive is a "difference" found where none exists. Per Evan Miller (post of April 18, 2010, updated May 2013), stopping the moment 5% significance appears invalidates the reported significance. In his example (50% baseline, a useless change, stop at 5% or after 150 observations) the false positive rate is 26.1%.
He calls it a worst case; to keep a true 5%, 1 interim look (plus the final read) needs a reported threshold of 2.9%, 2 looks 2.2%, 3 looks 1.8%, 5 looks 1.4% and 10 looks 1.0%. Counting the final read is Click Star's inference from simulating evenly spaced looks.
Click Star's simulation: 1,000,000 A/A runs (2 identical arms), 3% baseline, 993 people per arm per day for 14 days (13,902 in total). Results are checked once a day (14 looks) with a two-sided two-proportion z-test, stopping as soon as p falls below 0.05.
Although nothing differs, about 22% of runs find a "difference"; reading once on the last day gives about 5.0%. It is a simple model, not a real measurement.
There are 2 remedies. Option 1: fix the sample and read once, like Optimizely's fixed horizon mode. Option 2: use sequential methods; Statsig describes sequential testing as adjusting p-values so early reads do not inflate false positives, valid only inside that tool.
Many variants and many metrics increase error
Every extra comparison is another chance of a false positive. Per GrowthBook, 10 experiments with 2 variants and 10 metrics each make 100 tests, pushing the false positive chance above the chosen α.
Click Star calculates: with 20 independent tests at 5% each and no real effect, the chance of at least 1 "significant" result is 64.2%. Dividing the threshold by the number of tests (Bonferroni) gives 0.25% per test; independence is a simplification.
Low-traffic websites: what to do instead
At 200 new people a day and a 3% baseline, detecting a 20% lift needs 140 days. Small and mid-sized sites may land here; Click Star has no measurement of typical Vietnamese traffic.
Weak tests also do harm. Per Lukas Vermeer and colleagues (KDD 2026, updated September 2, 2026), many older estimates may come from tests with power below 50%, which exaggerate effects. In 8 reruns (median 2.4 million users), effects were substantially smaller than previously claimed; only 2 of 8 were significant in the expected direction and 1 in the opposite direction.
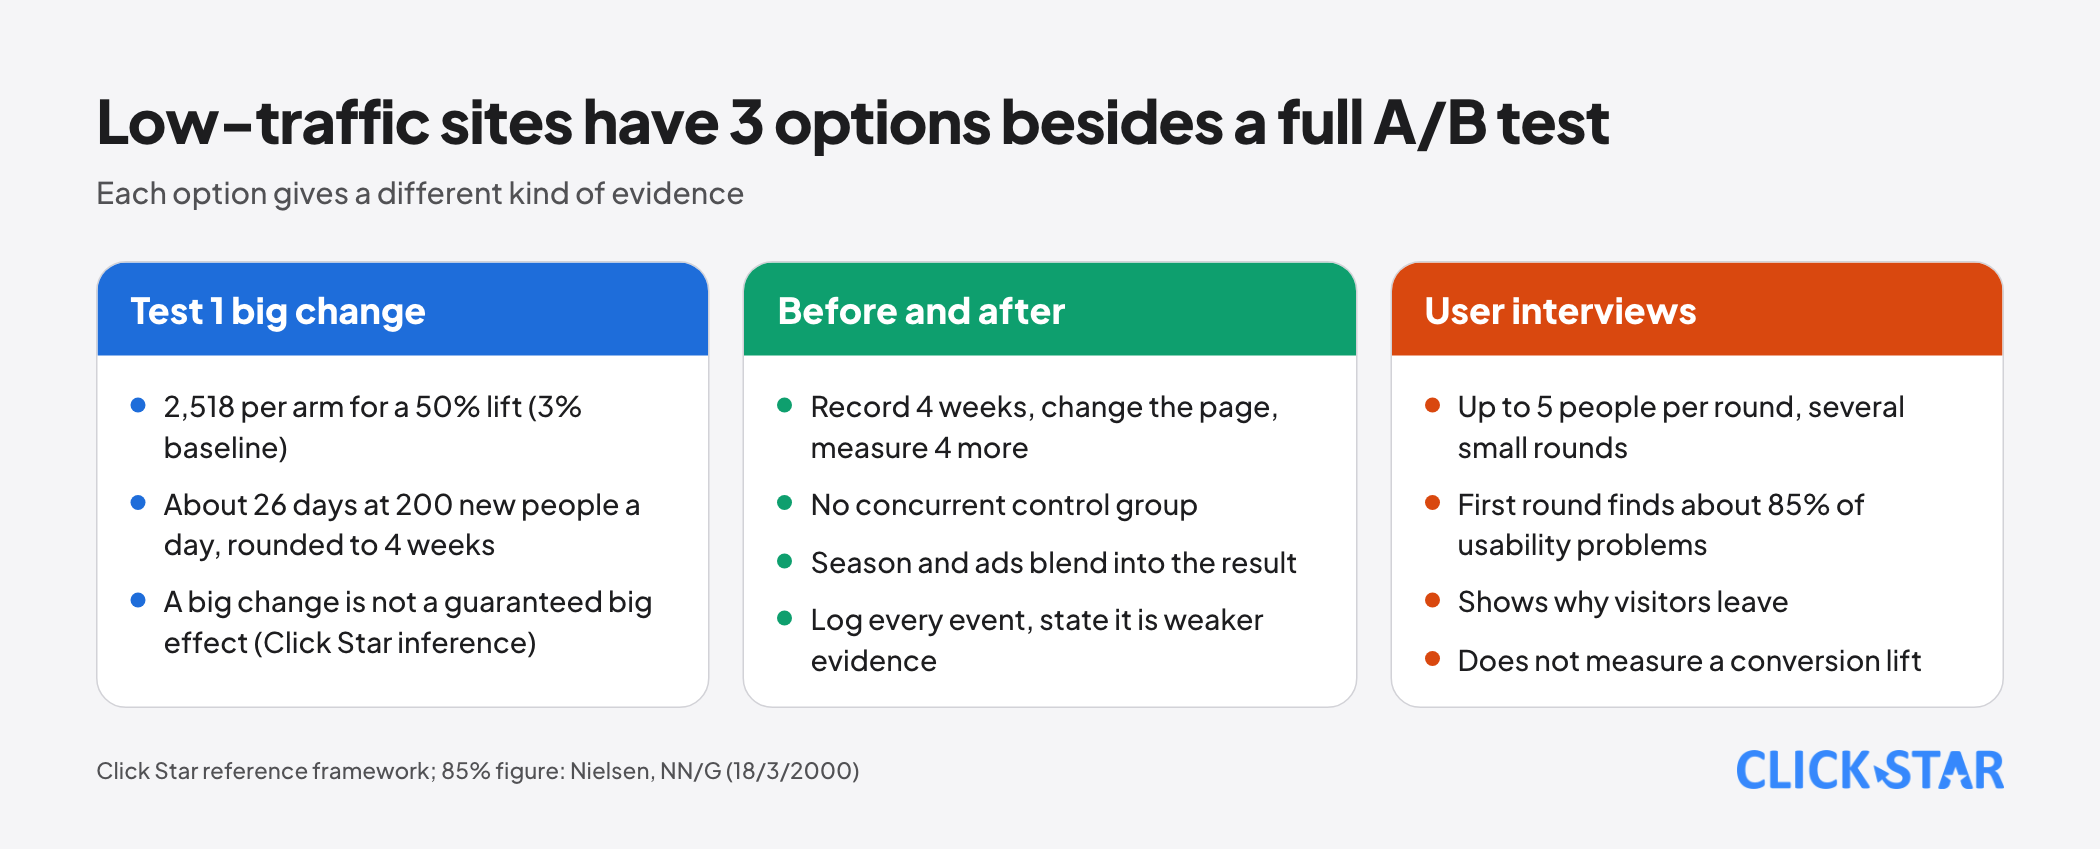
The 3 options below are a Click Star reference framework. First fix obvious defects such as speed and broken forms.
Option 1: test 1 big change. A 3% baseline and a 50% lift need 2,518 people per arm, about 26 days at 200 people a day, rounded to 4 weeks. Kohavi's group (2014) notes that at Bing most experiments fail and successes improve key metrics only 0.1% to 1.0% (measured on the overall metric, once diluted).
In Click Star's inference, a big change is not a guaranteed big effect: 50% is only the lift needed to see it in 26 days, and many tests will not reach it.
Option 2: before and after, with stated limits. Record a 4-week baseline, change the page, measure the next 4 weeks. With no concurrent control, season and ads blend in; log every event and say this is weaker evidence than an A/B test.
Option 3: interviews and observation. Per Jakob Nielsen (NN/G, March 18, 2000), test with up to 5 people in several small rounds; the first round finds about 85% of usability problems.
A/B testing email
Email has built-in randomization and fast results, but the message must reach the inbox: Click Star already has a separate article on SPF, DKIM and DMARC.
Per Mailchimp's guide (undated), a test goes to at least 10% of recipients, with at least 5,000 contacts per version recommended. For content tests it advises picking the winner by click rate because opens happen before the recipient sees the content.
Per Apple, Protect Mail Activity downloads remote content in the background by default, whether or not the user engages; Mailchimp says A/B results based on open rate may be inaccurate.
For small lists, Click Star calculates (2% baseline click rate, 80% power, 95% confidence): 5,000 per arm detects only about a 43% relative lift, and 1,000 needs about 108%. Test big differences, 1 element at a time.
What this means for Vietnamese businesses
Click Star's view. For most small and mid-sized websites, measure conversion correctly, connect it to the CRM and fix obvious defects before testing; when traffic is short, before-and-after comparison and customer interviews are more honest than a weak test. Click Star sells website, digital marketing, CRM and dashboard services, so it benefits from advising investment in measurement.
A 6-week plan for the first test
A Click Star reference framework, assuming about 1,000 new people entering the test a day and a 3% baseline, not from outside sources:
- Week 1: write the hypothesis, pick the primary and guardrail metrics, calculate the sample, run an A/A test or check tracking.
- Week 2: start at the beginning of the week, check SRM after 1 to 2 days, do not read the primary metric.
- Week 3: keep running, log any ad or event changes, check SRM again.
- Week 4: keep running, do not stop early.
- Week 5: finish the full 28 days and the calculated sample, then stop.
- Week 6: read the result once, check guardrail metrics, record the decision.
Common mistakes
- Stopping as soon as the tool says "significant", without waiting for the calculated sample.
- Skipping the sample size, so the smallest detectable lift is unknown.
- Running under 7 days or ending mid-week.
- Reading results when the split ratio is off without finding the cause.
- Tracking many metrics and groups, then picking the one that "won".
- Choosing an email winner by open rate.
What is not known
Click Star has no Vietnam measurements for website traffic, baseline conversion rates, A/B test adoption or the share of users with Apple Mail Privacy Protection.
The 2014 KDD paper was read through text extracted from its PDF, so check the Bing figures against the original. Optimizely marks fixed horizon mode as beta.
Related posts
Need tailored advice for your business?
Click Star helps you build a solution that fits your industry and scale. We answer every question during business hours.