RFM customer segmentation: how to calculate, score and use it in a CRM
How RFM is calculated and scored, with a tested PostgreSQL query, a 6-segment framework, its limits and how to measure with a control group. Based on Braze, Adobe, Klaviyo, PostgreSQL and the Fader, Hardie, Lee paper.
Many businesses hold thousands of customers in a CRM yet send the same message to all. RFM is a simple way to segment, using only 3 items already in the order table: purchase date, number of purchases and amount spent.
Sources: Braze, Adobe Commerce Intelligence, Klaviyo and PostgreSQL documentation, and the paper by Fader, Hardie and Lee (revised February 2005), checked as of October 22, 2026. Click Star ran the SQL on PostgreSQL 16.2 with fake data.
It answers 4 questions: how RFM is calculated and scored, how to use it in a CRM and in campaigns, where its limits lie, and how to measure results.
Key points
- RFM scores each customer on how recently they bought (Recency), how often (Frequency) and how much they spent (Monetary), usually on a scale from 1 to 5.
- No single standard exists: Braze and Adobe split into 5 equal groups of 20%, Klaviyo uses a scale from 1 to 3, and the Fader team uses average spend per order, not total.
- NTILE(5) in PostgreSQL scores customers at once, but customers with the same order count can still get different scores unless ties are handled.
- Data must suffice: Klaviyo's RFM report requires at least 500 customers with orders and 180 days of history; Click Star has no general threshold for every industry.
- RFM describes past behavior, does not explain causes, and is sensitive to purchase cycles. New customers, B2B and product groups need separate handling.
- To learn whether a segment adds revenue, keep a random control group with no campaign and compare over the same period.
What RFM is and where it comes from
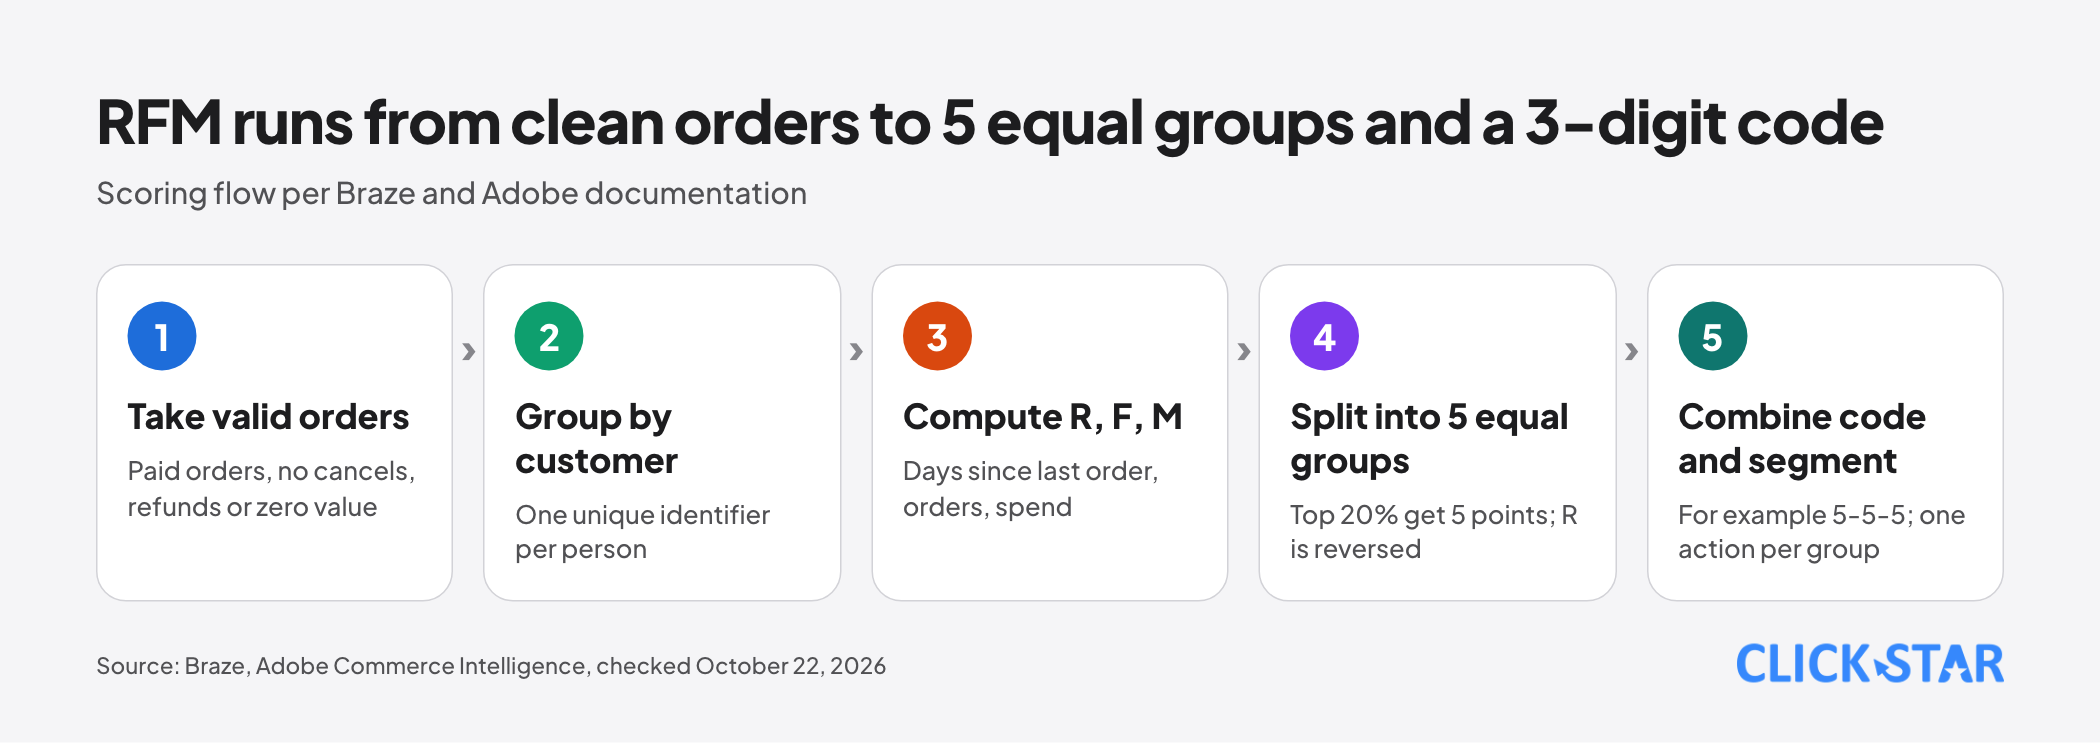
According to Braze (published May 23, 2025, last edited November 11, 2025), RFM groups customers by transaction behavior. Each measure is ranked, split into 5 equal groups, then combined into a code such as 5-5-5 or 1-2-1.
Fader, Hardie and Lee (revised February 2005) call summarizing past purchasing with R, F and M common practice, drawn from the direct marketing literature. Per Wikipedia (secondary), the paper appeared in the Journal of Marketing Research.
Calculating the 3 measures: R, F, M
Start from a clean order table: count paid orders only, excluding cancellations, refunds and zero-value orders. Klaviyo counts only positive-value orders (help page updated November 18, 2025).
- R (Recency): days from the latest order to the calculation date. Adobe Commerce Intelligence (updated October 8, 2026) uses seconds since the latest order.
- F (Frequency): number of orders in the time window. Adobe uses lifetime order count.
- M (Monetary): net spend. Adobe uses lifetime revenue; Fader and colleagues use average spend per order.
Total versus average changes the meaning. Total spend tracks order count, so F and M move together; average per order separates few large orders from many small ones.
Fix the time window to the industry's purchase cycle. Each customer also needs one unique identifier: orders from Zalo, the website and a store not linked to one person make F falsely low.
Scoring: percentile groups and variants
Braze splits each measure into 5 equal groups: the top 20% get 5 points, the next 20% get 4, down to 1. Adobe does the same. R must be reversed: fewer days since the last order means a higher score.
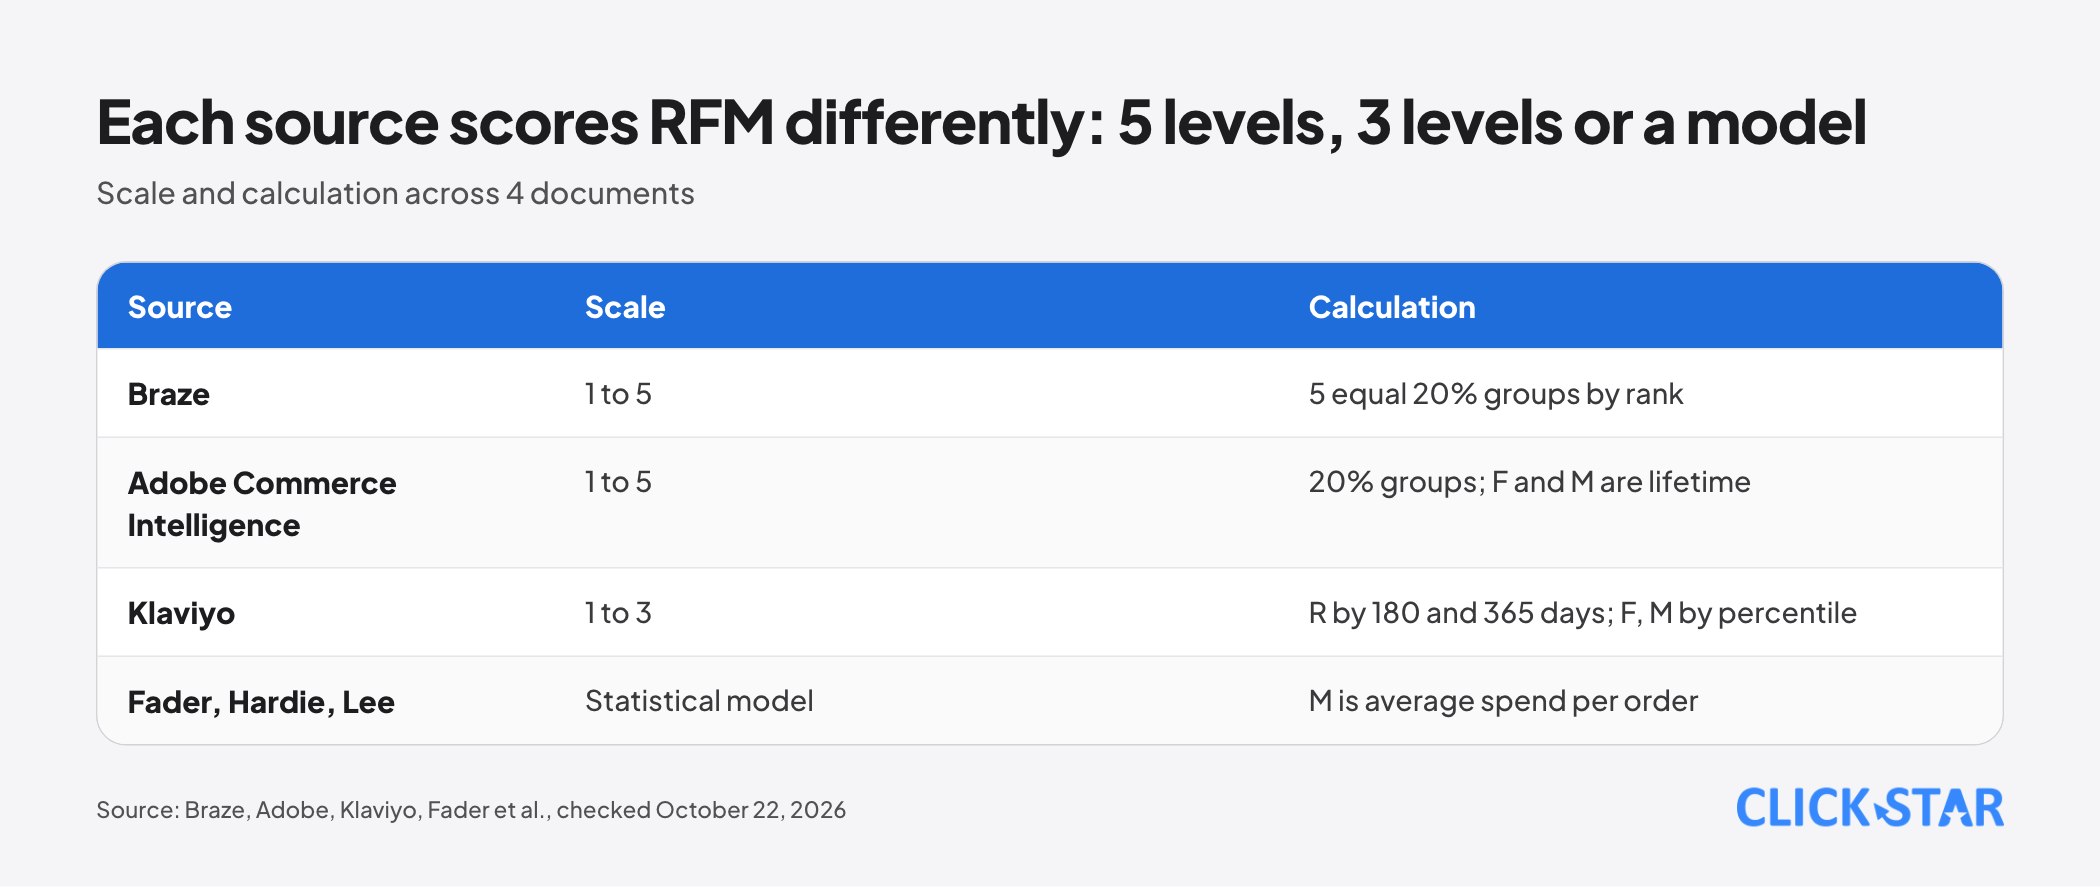
Klaviyo uses a scale from 1 to 3. Recency uses day thresholds: an order within 180 days scores 3, within 365 days scores 2, older and unlikely to buy again per Klaviyo scores 1. Frequency and Monetary use percentiles, with the top 33% scoring 3.
Click Star's inference, not from an outside source: with few customers use 3 levels so each cell keeps enough people, with many use 5. Klaviyo's 500 customers is a condition of its report, not an industry standard.
SQL example for RFM in PostgreSQL
The PostgreSQL 18 documentation (read October 22, 2026) says ntile(num_buckets) returns an integer from 1 to the argument, dividing the partition as equally as possible. The code is a Click Star illustration on a hypothetical orders table (order_date is a date).
WITH base AS (
  SELECT customer_id,
         DATE '2026-10-22' - MAX(order_date) AS recency_days,
         COUNT(DISTINCT order_id) AS frequency,
         SUM(net_amount) AS monetary
  FROM orders
  WHERE order_date BETWEEN DATE '2025-10-23' AND DATE '2026-10-22'
    AND status = 'paid' AND net_amount > 0
  GROUP BY customer_id
), scored AS (
  SELECT *,
         NTILE(5) OVER (ORDER BY recency_days DESC, customer_id) AS r,
         NTILE(5) OVER (ORDER BY frequency, customer_id) AS f,
         NTILE(5) OVER (ORDER BY monetary, customer_id) AS m
  FROM base
)
SELECT customer_id, r, f, m,
  CASE
    WHEN r >= 4 AND f >= 4 AND m >= 4 THEN 'vip_dang_hoat_dong'
    WHEN r <= 2 AND f >= 4 AND m >= 4 THEN 'vip_nguy_co_roi_di'
    WHEN r >= 4 AND f <= 2 THEN 'moi_it_mua'
    WHEN r <= 2 AND f <= 2 THEN 'ngu_dong'
    WHEN r <= 2 THEN 'giam_dan'
    ELSE 'deu_dan'
  END AS segment
FROM scored;
R sorts days in descending order so the most recent buyers receive 5. When the count is not divisible by 5, group sizes differ by at most 1: Click Star split 7 rows into 3 groups on PostgreSQL 16.2 and got 3, 2 and 2.
NTILE cuts by row position, not value. When many customers have the same order count, they can still get different F scores, only because of the extra customer_id column. With many ties, consider fixed bands (1, 2, 3 or more orders) instead of percentiles.
Click Star's reference framework for segments
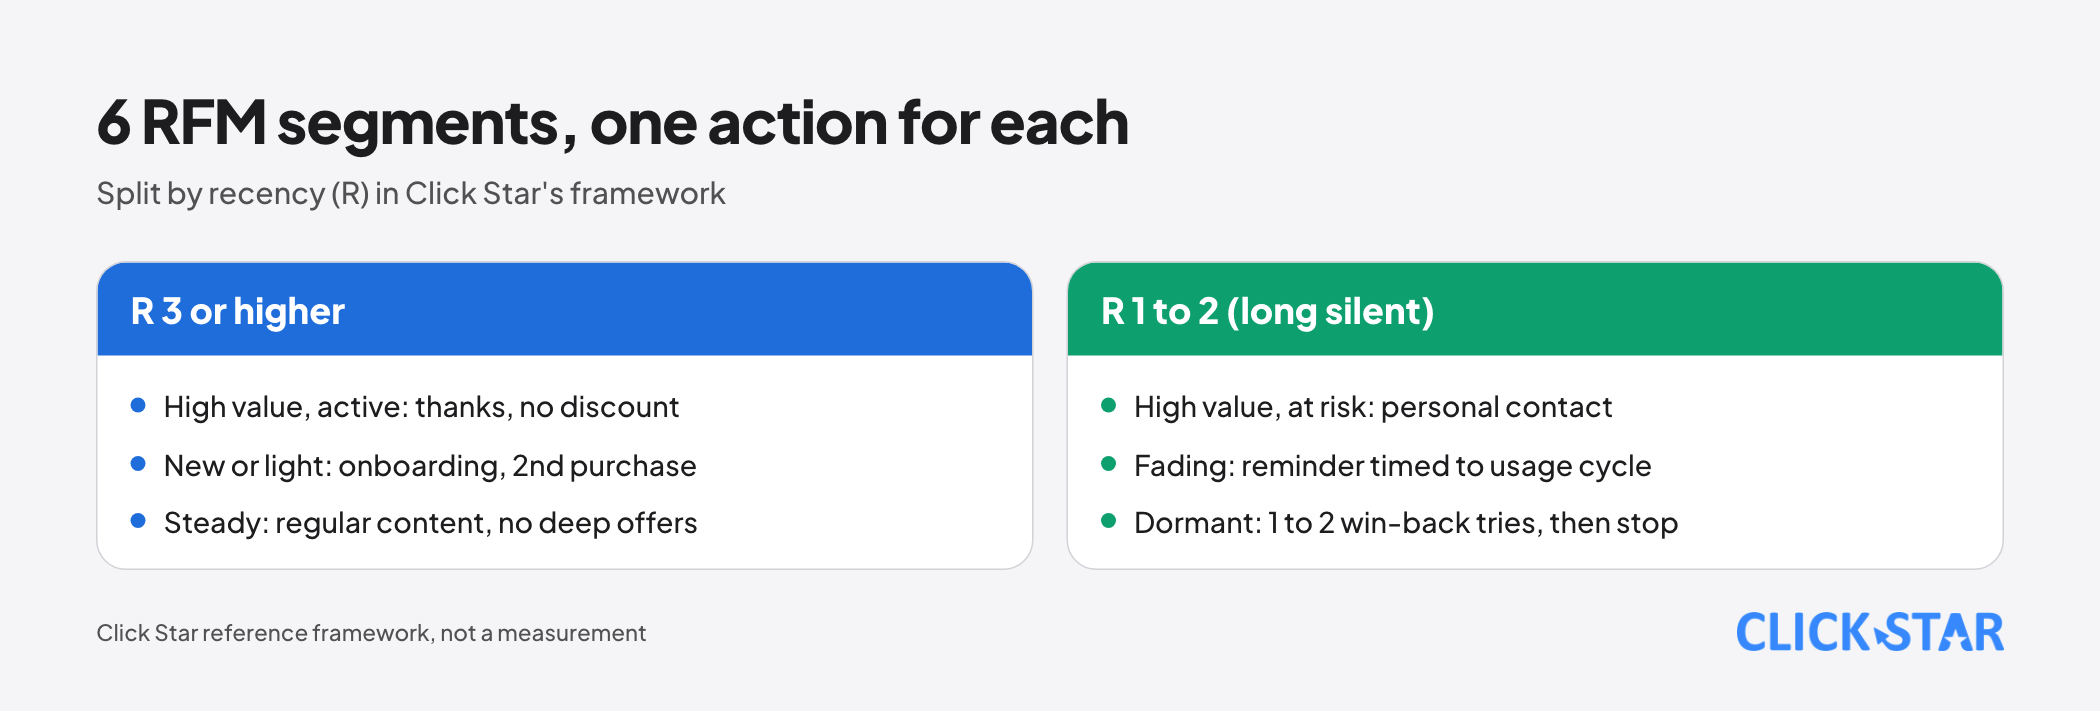
This is the 6-segment framework the SQL uses: a Click Star reference framework, not from an outside source and not a measurement. Adjust it to the industry's purchase cycle.
- High value, active (R 4 to 5, F 4 to 5, M 4 to 5): buys often, spends a lot, bought recently.
- High value, at risk of leaving (R 1 to 2, F 4 to 5, M 4 to 5): once a strong customer, now silent. Contact personally first.
- New or light (R 4 to 5, F 1 to 2): bought recently, has not repeated.
- Dormant (R 1 to 2, F 1 to 2): long silent, low purchases.
- Fading (R 1 to 2, F 3 or more, not high value): bought steadily, now drifting away.
- Steady (everything else, R 3 or higher): average buying, no special action yet.
Data conditions: purchase cycle, new customers, B2B and missing data
Purchase cycle. R only means something against the usual buying rhythm. Click Star's inference: a store selling durables bought once every 2 years will show most customers with low R though nobody has left.
New customers. Customers with 1 order all have F equal to 1, so F cannot tell them apart. Treat them as a separate group and score only repeat buyers.
B2B. Click Star found no open source on RFM for B2B. Click Star's inference: with a few dozen accounts, each large contract swings M, so percentile splits add noise. A per-account list with an owner and a renewal date is often more useful.
Missing data. Unlinked orders, duplicate customer IDs or refunds not deducted make scores wrong without any error. Klaviyo leaves RFM blank on profiles without enough data; do the same rather than assign a low score.
Limits of RFM
RFM shows what happened, not why. A customer with low R may have lost the need, switched to a competitor, hit a service problem or not yet reached the next buying date; the score cannot tell which.
Wikipedia (a secondary source) warns the top segment may be a chance pattern to re-check on another dataset. It also says score definitions depend on the business model and tiny subsegments can be merged.
Fader and colleagues treat R, F and M as imperfect indicators of underlying behavior and propose a statistical model (Pareto/NBD with gamma-gamma) to forecast lifetime value. RFM scores suit grouping for action, not forecasting.
RFM is also sensitive to purchase cycles and product groups: a customer buying both fast-moving and durable goods, merged into one F score, is distorted. Score by product group or service line.
The Fader paper also notes selection bias: if customers already got different offers based on past behavior, reading results needs great care. Hence the control group.
Using RFM in a CRM and in campaigns
Calculate RFM on a schedule (weekly or monthly), store the 3 scores and segment name on the CRM record, and filter email, Zalo, SMS or ad audiences by that field.
Click Star's CRM and CDP page states capabilities for segmenting customers, building remarketing audiences and automated messages by email, Zalo ZNS and SMS. Disclosure: Click Star sells this service.
Braze suggests rewarding top customers, re-engaging those who have not bought lately, or skipping low-engagement customers or routing them into a win-back flow. Applied to Click Star's framework:
- High value, active: thanks, early access, no discount needed.
- High value, at risk of leaving: the owner reaches out and asks why, not a mass discount code.
- New or light: an onboarding series and a prompt for the 2nd purchase.
- Fading: a reminder timed to the product's usage cycle.
- Dormant: 1 to 2 win-back attempts, then stop sending.
- Steady: regular content, no deep offers.
Send only where the customer agreed to receive messages, and cap weekly messages per customer.
Measuring results with a control group
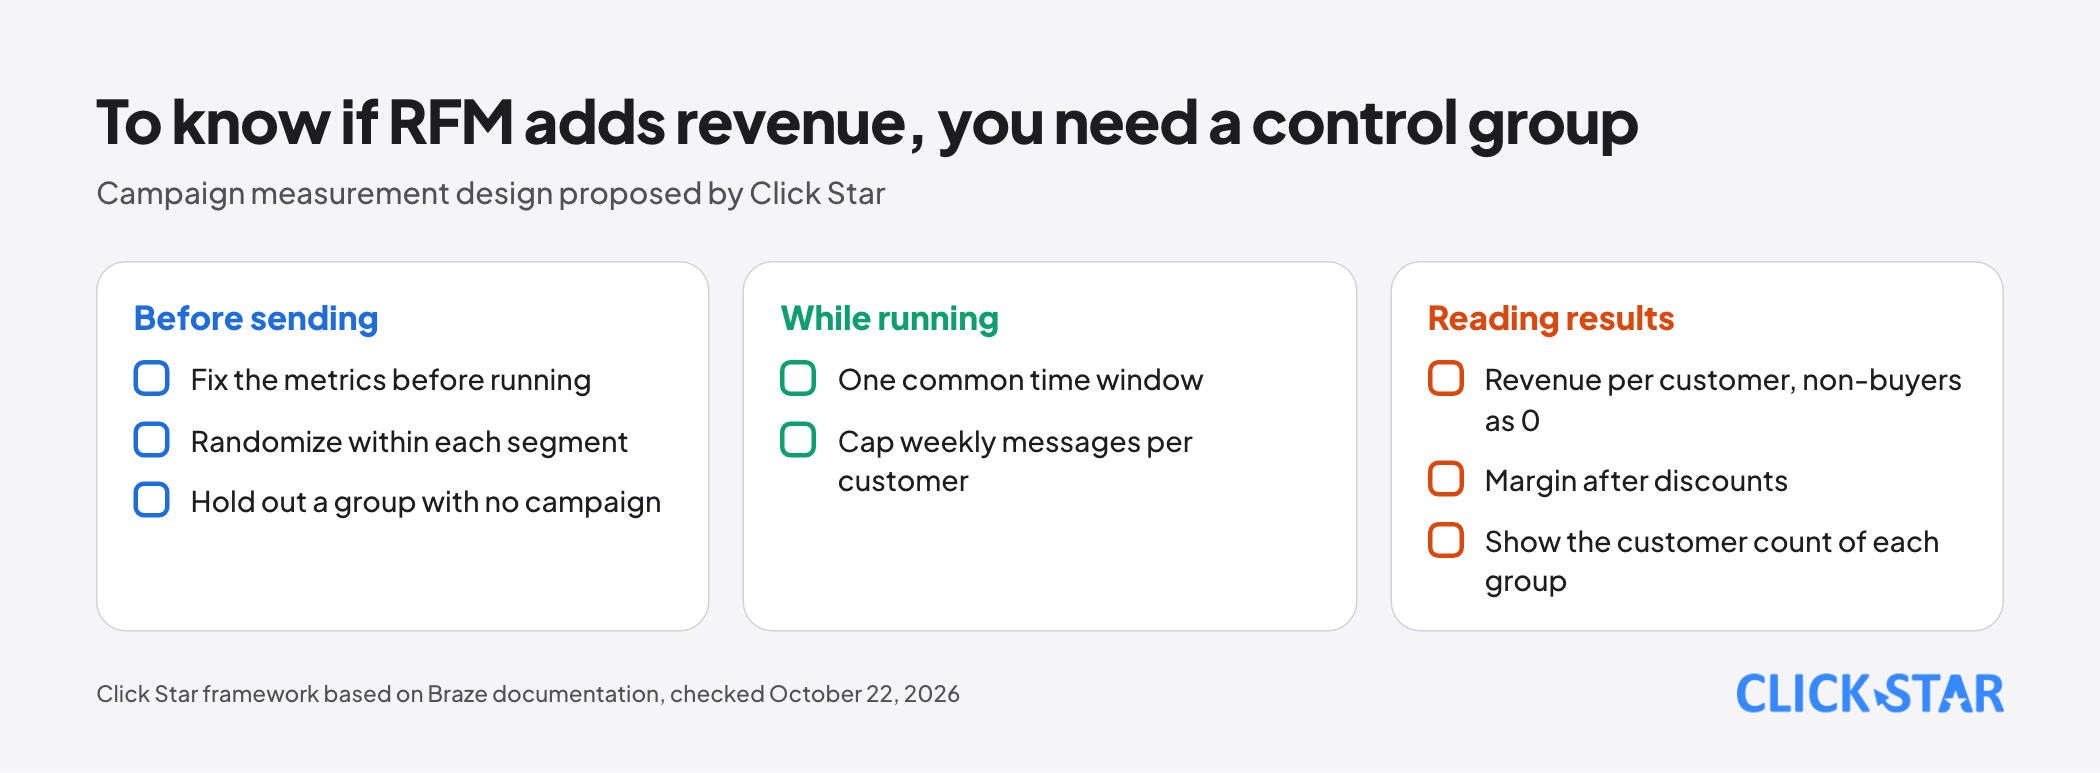
Comparing before and after is not enough, because some customers return on their own. A cleaner method is a random control group that receives no campaign, compared with the group that does over the same period.
Braze's Global Control Group documentation (no date shown, read October 22, 2026) describes this for its product: a random share of users is excluded from campaigns and Canvases (except API campaigns and tagged exclusions), and a report compares the two groups.
Braze's testing guidance: at least 1,000 users, no more than about 10% of the audience (up to 15% below 10,000 users), at least 1 month. These suit Braze, not all cases; small conversion counts make results volatile.
Click Star's proposed method, based on the documents above:
- Randomize within each segment.
- Fix the metrics in advance: repurchase rate within N days, revenue per customer (non-buyers count as 0), margin after discounts and unsubscribe rate.
- Keep customers who did not open the message in the treated group.
- Read results over one common window, with each group's customer count.
Click Star's view. RFM is a sensible first step when a business has clean order data and wants to stop sending one message to everyone. Its value is forcing the team to name each group and give it an action, not score precision.
The main risk is believing the score explains behavior. Proof of effect belongs to controlled tests. Click Star sells CRM and CDP services, so weigh this view accordingly.
30-day plan
- Week 1: fix the definition of a valid order, the time window and the customer identifier; count orders not linked to one person.
- Week 2: run the query on real data, check F for ties, choose a 3-level or 5-level scale and settle on 5 to 6 segments.
- Week 3: store scores and segments on CRM records, write 1 action per segment and a sending cap.
- Week 4: run the first campaign with a control group and set a date to read results by purchase cycle.
Common mistakes
- Splitting by percentile without handling tied values, so identical customers get different scores.
- Using another platform's thresholds (180 days, 500 customers) for an industry with a different purchase cycle.
- Reading a low R as a lost customer when the purchase cycle may be longer than the window in use.
- Merging every product group and channel into one score.
- Discounting a group that already buys steadily, losing margin without adding orders.
- Comparing before and after a campaign without a control group, then concluding RFM works.
What is not known
Click Star has no measurement of revenue gains from RFM at Vietnamese businesses and cites no effectiveness percentage because no reliable open source exists. There is no general minimum customer count or scoring split by industry, and no open source on RFM for B2B.
Who devised the method is unidentified.
Related posts
Need tailored advice for your business?
Click Star helps you build a solution that fits your industry and scale. We answer every question during business hours.